How to create a gantt chart for event rooms during a day
-
Hi all,
This will be my first ever post in a forum like this. But searching around the web and been spending to many hours allready, I tried finding a great community to join.
Scenario - I`m working for a customer that are running some big event properties, they are lacking a good gantt chart overview for each conference/event inside their system and wanted us to create it in report builder for their SSRS solution.
One conference (can run over multiple dates) can have many events (the event can only be on one date).
The events holds conference room, servings, date and the start and end time.
for example
Conference XY have 2 events
- Meeting Event in room conference room 1 between 08:00 and 16:00
- and a break event in conference room "Break area A" between 09:30-11:00.
they would like the Gantt chart to start the same as the first event starts that day (this case 08:00) and the chart should end when the last event ends (in this case 16:00)
Ifthe conference is over multiple dates, then the next date follows.
This is what they would like

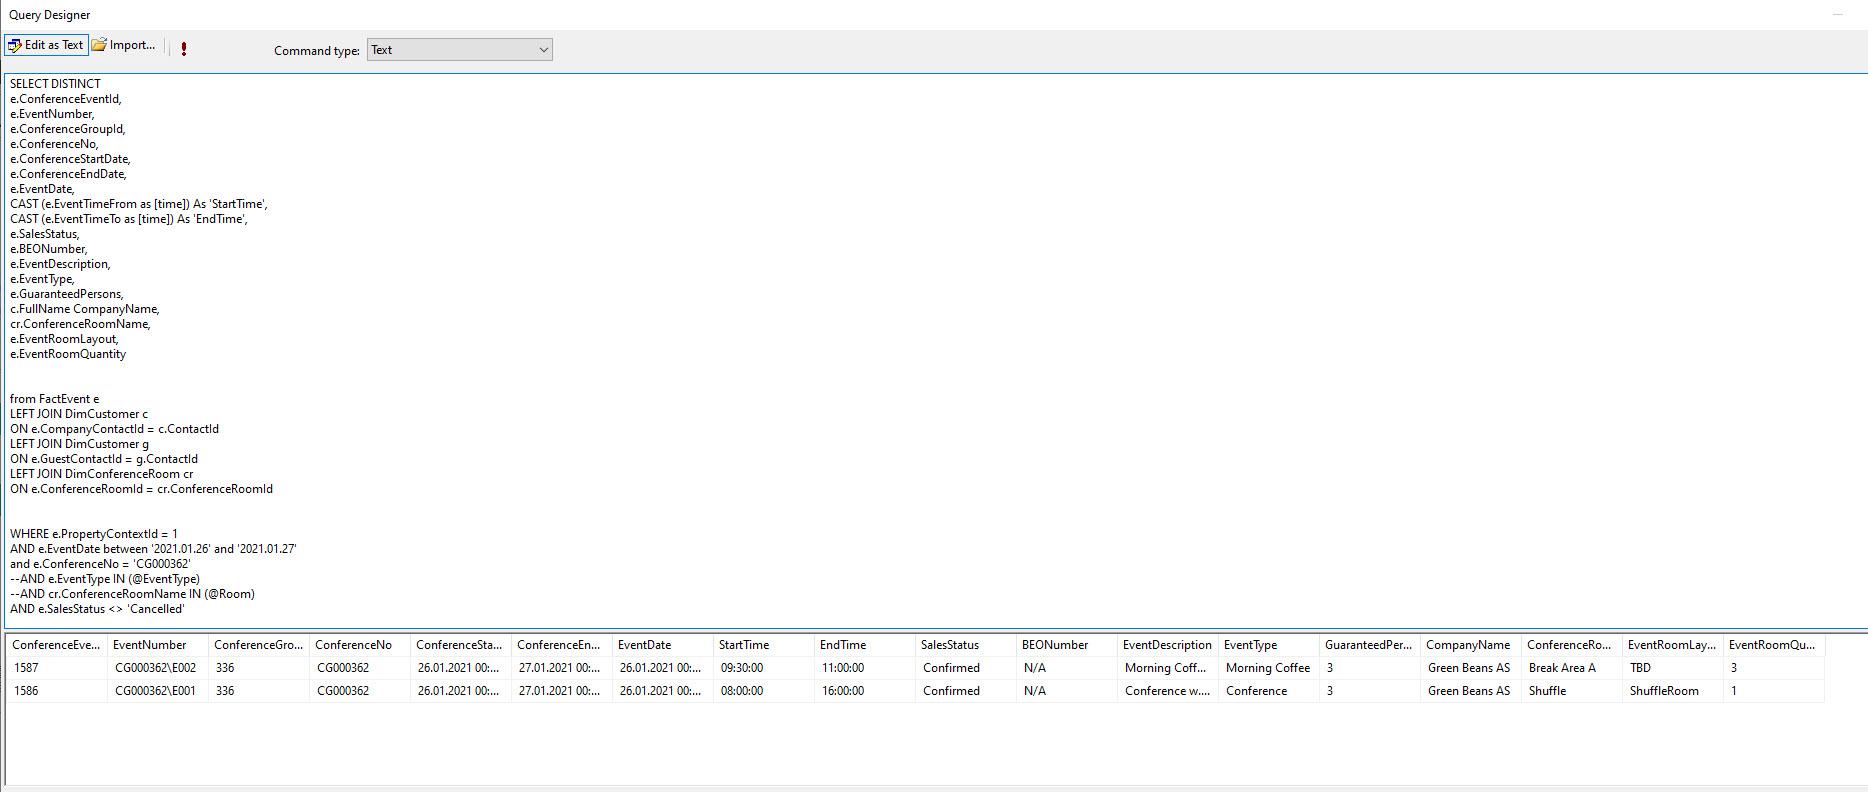
and I have a dataset that looks like this
This is showing all information that is needed. But man oh man, I can not in my life figure out how to do this. Only examples I find is for bigger projects, running over weeks, months and years.
So if someone can help out I will of course give all information needed.
-
Thanks for posting your issue and hopefully someone will answer soon.
This is an automated bump to increase visibility of your question.

Viewing 2 posts - 1 through 2 (of 2 total)
You must be logged in to reply to this topic. Login to reply