How to check I/O Bottle necks
-
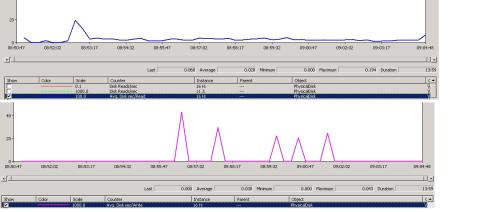
I have attached perfmon report(SQL server to check disk IO) here for Average disk Sec/Read & Average disk Sec/write.
physical disk. average disk/sec read and write is normal or need to be take steps to fix it.I dont know how to calculate to disk I/O.Please some one can help me. I have attached report.

- vigneshbeece - Monday, November 13, 2017 9:33 PM
PerfMon reports on the number of seconds for those disk measurements. A lot of the articles on evaluating those are looking for milliseconds so multiply by 1000 to get milliseconds. Pay attention to whatever measurement is being used for a threshold - seconds or milliseconds.
In PerfMon, it's usually better to just use the average you capture as there will always be some spikes. But sustained spikes would be something to look at.
And then you will find that there are different thresholds or what should be "good numbers" reported by different groups of people. But they are close.
You have averages on those of
.028 seconds or 28 ms
.030 seconds or 30 ms
Those will generally fall in the not too good or bad category. So it's something to look into.You also want to keep in mind that PerfMon is capturing the statistics for the server which can be things other than SQL Server.
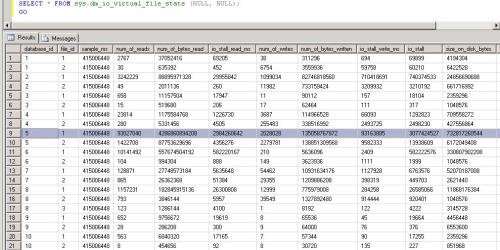
To look at just SQL Server statistics, most people will also look at the DMV sys.dm_io_virtual_file_stats to capture the statistics by database file to get a better idea of where the issues are as that can play a part in how you address it. It usually gives you an idea of where the queries are that need to be tuned.
You can find more information on that DMV in this blog post - and follow the link at the beginning for a script you can use to capture the I/O latencies:
How to examine IO subsystem latencies from within SQL ServerSome of the PerfMon threshold numbers (and the variations) are listed in this article:
Monitoring Read/Write LatencyYou only need to read the first half of the article - the seconds part is promoting a promoting a SQL Sentry product.
But that article will also tell you other things you can look into when you find the disk performance being not too good. It generally comes down to tuning queries, fixing code but if you check some of the other DMVs, that can help you narrow things down, find hot spots, etc. Sometimes it can be hardware or network but more often it will be code. You need to keep an open mind and be receptive to it being anything. Personally I think it's a good idea to look at the query stats when doing this as well but I usually work my way down to that one after capturing the other things mentioned in the articles.
Capturing things from a few different angles helps to prevent missing potential issues contributing to or causing the problems. Things like high latency in Perf Mon but low latency in virtual file stats generally tells you something outside of SQL Server is eating up the disks. I think it's a good practice to just be open minded about what the issues could be and check all the different pieces. Too often we can see something and then assume it is one thing or another (or assume it can't be one thing or another) and incorrectly pursue that path and it ends up being something else we hadn't thought of.
One area of a performance problem doesn't necessarily mean it's that specific area that is deficient or problematic. You may be going to disk a lot and pushing up the I/O and start seeing disk latency. But that may not have anything to do with the disks and the queries may be fine but you don't have nearly enough memory for your workload type.Sue
- Sue_H - Tuesday, November 14, 2017 6:25 PM
Thanks a lot. I have attached virtual IO file stats report and aggregate information . Can you please check this? I dont know how to analyze this.
- I think this might help you look at it better. This script is pulling data from sys.dm_io_virtual_file_stats but it will use the database and files and also do the calculations for the averages. You can change how you order it depending on which average stall you want to see. It's a part of Glenn Berry's diagnostic scripts for SQL Server 2008:
-- SQL Server 2008 R2 Diagnostic Information Queries
-- Glenn Berry
-- CY 2017
-- Last Modified: October 5, 2017
-- https://www.sqlserverperformance.wordpress.com/
-- https://www.sqlskills.com/blogs/glenn/
-- Twitter: GlennAlanBerry-- Calculates average stalls per read, per write, and per total input/output for each database file (Query 20) (IO Stalls by File)
SELECT DB_NAME(fs.database_id) AS [Database Name], CAST(fs.io_stall_read_ms/(1.0 + fs.num_of_reads) AS NUMERIC(10,1)) AS [avg_read_stall_ms],
CAST(fs.io_stall_write_ms/(1.0 + fs.num_of_writes) AS NUMERIC(10,1)) AS [avg_write_stall_ms],
CAST((fs.io_stall_read_ms + fs.io_stall_write_ms)/(1.0 + fs.num_of_reads + fs.num_of_writes) AS NUMERIC(10,1)) AS [avg_io_stall_ms],
CONVERT(DECIMAL(18,2), mf.size/128.0) AS [File Size (MB)], mf.physical_name, mf.type_desc, fs.io_stall_read_ms, fs.num_of_reads,
fs.io_stall_write_ms, fs.num_of_writes, fs.io_stall_read_ms + fs.io_stall_write_ms AS [io_stalls], fs.num_of_reads + fs.num_of_writes AS [total_io]
FROM sys.dm_io_virtual_file_stats(null,null) AS fs
INNER JOIN sys.master_files AS mf WITH (NOLOCK)
ON fs.database_id = mf.database_id
AND fs.[file_id] = mf.[file_id]
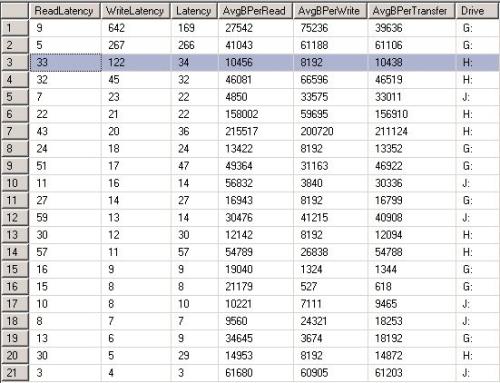
ORDER BY avg_io_stall_ms DESC OPTION (RECOMPILE);For now, just worry about those first few columns with average read stall, write stall, io stall.
Pay attention to any of those that are greater than 30 - 50 range. If it's a lot, just worry about those over 50.
Then the right it will tell you which database and which file/file type (log file or data file). So that will give you an idea of what databases and what type of activity have the most latency. From there it really depends what all you find and you probably won't get what you need through a forum post so you will need to do some research too.
That second link earlier to Monitor Read/Write Latency article has some steps of things to look for.
If I saw a user database being the worst and mostly in just one database, I'd start looking at the queries, the indexes, the statistics for that database. You can check the query stats for that database, look for the queries with the most executions, reads and writes. A query can be high on some things like reads or writes but if it's not called to often and has low execution count, it might not be as important as one that has a large execution count. You may have queries run once a day during slow hours and those typically won't hurt as much as one that is called 100 times an hour every day.
If the numbers are bad for tempdb, you want to check if you have the files configured correctly and if it's used a lot. You can tell which files are used more by looking to the right of the results of that query and look at the number of reads and number of writes (num_reads and num_writes).
As I said, that Monitor Read/Write Latency article has steps of other things to look for. When he mention hot spots, that would be looking at what disks or databases are involved for the most latency, the most reads and writes. You sometimes you need to adjust things with what files are where or the I/O path could be an issue somewhere but usually it's due to poor query performance. You usually want to make sure to check memory when you are seeing disk latency as memory pressure can mean you go to disk more often.
You can search for some scripts you can use to look at the query performance. The guy who wrote the code I pasted above for you has a set of diagnostic queries that are great to have. The link to his site for the scripts is in the comments of the code I pasted above. There are also scripts available to search the query plans which are good for looking for scans.
So there is a lot involved and a lot to learn about. As I said, you won't be able to get everything you need from a forum post. Hopefully I gave you enough information to get started.Sue
Viewing 4 posts - 1 through 3 (of 3 total)
You must be logged in to reply to this topic. Login to reply