Going all solid state drives - latch timeout - large buffer cache
-
We're testing the use of 100% enterprise solid state drives ( netapp ) for all databases. Our test environment is just like production with 512GB of memory ( 448 allocated to sql ). This week we concluded baseline testing on magnetic disks ( netapp san ) and flipped over to a copy of the databases on SSD. We saw almost no improvement but then I realized the testing was mainly OLTP, not the big report queries that are our main concern. Also, our buffer cache hit ratio stays near 100% most of the time so my theory is that we're measuring memory speed not disk IO speed.
I also noticed an instance of latch timeout in the sql log during the SSD testing ( never see those in production ) and the dump revealed one our of our "nightly" batch jobs that used to finish at night but now that the DB has grown, spills over into the daytime. Not sure if the latch timeout has anything to do with running on SSD. ???
We need to change to long-running, heavy read queries for testing but the other questions are whether to limit sql to a small amount of memory or empty the buffer cache before each test ( or both ) ? Of course that means creating a new magnetic baseline and delaying our production deployment scheduled in two weeks.
- Indianrock - Saturday, May 27, 2017 6:16 AM
Neither.
You're testing to see how the application behaves? Then test using the conditions that the app will run in.The buffer cache hit ratio is *always* near 100%, that's why it's a useless counter to track memory utilization.
With SSDs, you'll probably be seeing fewer queries waiting for PAGEIOLATCH_**, and fewer waiting for WRITELOG or other io operations.Can you post the entire latch timeout error?
Gail Shaw
Microsoft Certified Master: SQL Server, MVP, M.Sc (Comp Sci)
SQL In The Wild: Discussions on DB performance with occasional diversions into recoverabilityWe walk in the dark places no others will enter
We stand on the bridge and no one may pass -
Here's the latch timeout info. I'm attaching an image showing memory use from our Spotlight tool. The graphs have legends but for the one called "Cache" the explanation is:
"The Cache chart shows the amount of memory allocated to the Buffer Cache and the Procedure Cache over time.The buffer cache will normally be the largest memory cache used by SQL Server. Note: (SQL Server 2012) Shows also the amount of memory allocated to Free Pages and Stolen Pages over time.
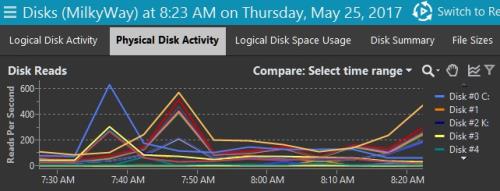
The other attached image shows IO in the time leading up to the latch timeout --- shows big drop in logical reads during that period.So you're saying buffer cache hit rates near 100% do not indicate sql is able to get most data from memory?
In the attached screen shot, it shows memory used for sort,hash,index jumping up just prior to the latch timeout.Current time is 11:34:55 05/24/17.
=====================================================================
BugCheck Dump
=====================================================================
This file is generated by Microsoft SQL Server
version 11.0.3350.0
upon detection of fatal unexpected error. Please return this file,
the query or program that produced the bugcheck, the database and
the error log, and any other pertinent information with a Service Request.
Computer type is Intel(R) Xeon(R) CPU E5-4640 0 @ 2.40GHz.
Bios Version is HP - 2
64 X64 level 8664, 2 Mhz processor (s).
Windows NT 6.1 Build 7601 CSD Service Pack 1.
Memory
MemoryLoad = 86%
Total Physical = 524253 MB
Available Physical = 70202 MB
Total Page File = 559220 MB
Available Page File = 102240 MB
Total Virtual = 8388607 MB
Available Virtual = 7695118 MB
**Dump thread - spid = 0, EC = 0x000000087444A750
***Stack Dump being sent to F:\MSSQL11.CMVS_PA\MSSQL\LOG\SQLDump0003.txt
* *******************************************************************************
*
* BEGIN STACK DUMP:
* 05/24/17 11:34:55 spid 67
*
* Latch timeout
*
* Input Buffer 262 bytes -
* C DELETE TITLES_WITH_DUPLICATE_VINS_CRITERIA FROM TITLES_WITH_D
* UPLICATE_VINS_CRITERIA AS TitlesWithDuplicateVinsCriteria02
*
* *******************************************************************************
* -------------------------------------------------------------------------------
* Short Stack Dump
===================================================
===================================================
2017-05-24 11:34:55.35 spid67 A time-out occurred while waiting for buffer latch -- type 4, bp 000000731C622940, page 9:28304, stat 0x10b, database id: 8, allocation unit Id: 72059654354436096, task 0x0000000003CC70C8 : 0, waittime 300 seconds, flags 0x100000001a, owning task 0x0000000003B7C928. Not continuing to wait.
2017-05-24 11:34:55.37 spid67 Using 'dbghelp.dll' version '4.0.5'
2017-05-24 11:34:55.38 spid67 **Dump thread - spid = 0, EC = 0x000000087444A750
2017-05-24 11:34:55.38 spid67 ***Stack Dump being sent to F:\MSSQL11.CMVS_PA\MSSQL\LOG\SQLDump0003.txt
2017-05-24 11:34:55.38 spid67 * *******************************************************************************
2017-05-24 11:34:55.38 spid67 *
2017-05-24 11:34:55.38 spid67 * BEGIN STACK DUMP:
2017-05-24 11:34:55.38 spid67 * 05/24/17 11:34:55 spid 67
2017-05-24 11:34:55.38 spid67 *
2017-05-24 11:34:55.38 spid67 * Latch timeout
2017-05-24 11:34:55.38 spid67 *
2017-05-24 11:34:55.38 spid67 * Input Buffer 262 bytes -
2017-05-24 11:34:55.38 spid67 * C DELETE TITLES_WITH_DUPLICATE_VINS_CRITERIA FROM TITLES_WITH_D
2017-05-24 11:34:55.38 spid67 * UPLICATE_VINS_CRITERIA AS TitlesWithDuplicateVinsCriteria02
2017-05-24 11:34:55.38 spid67 *
2017-05-24 11:34:55.38 spid67 * *******************************************************************************
2017-05-24 11:34:55.38 spid67 * -------------------------------------------------------------------------------
2017-05-24 11:34:55.38 spid67 * Short Stack Dump
2017-05-24 11:34:55.45 spid67 Stack Signature for the dump is 0x000000002828C951 -
So you're saying buffer cache hit rates near 100% do not indicate sql is able to get most data from memory?
That's exactly what it indicates. It's what % of times a page was needed and was found in memory.
Gail Shaw
Microsoft Certified Master: SQL Server, MVP, M.Sc (Comp Sci)
SQL In The Wild: Discussions on DB performance with occasional diversions into recoverabilityWe walk in the dark places no others will enter
We stand on the bridge and no one may pass -
Ok that's what I thought. So with that being near 100% ( except sometimes during evening index maintenance ), it's not clear how much help we're going to get from SSDs. Complaints about slowness are way down over the last few months which I'll have to attribute to index work, daily clearing of the plan cache and some query optimization by development ( they use an ORM so improvements can be done but are challenging ).
We use netapp snapshot backups ( biggest dB is nearing 7TB ) but when I took a native backup in this test SSD environment, it took 1/3 the time on SSD that did on magnetic.
With huge data skew between large and small clients, the plan cache is often not our friend. I hate to say it but for many of these report queries, option ( recompile) is the magic bullet. I've started what is going to be a year-long review of indexes and already made a few changes including disabling numerous unused indexes. What I'm seeing now is that over the "no DBA" years, development applied single-column indexes almost exclusively except for a few pulled from the database tuning advisor.
I'm no index guru, but I've seen many articles, including some of yours Gail, that indicate a general rule of combining columns from the where clause into index key columns, and at least some of the other "selected" columns into the INCLUDE portion. So that is the project which will keep me busy for quite a while ( can't dedicate myself to it full time ).
- Indianrock - Saturday, May 27, 2017 7:55 AM
The way SQL works, and the specific way that counter works, it will ALWAYS be close to 100%, even if there's massive amounts of data being read off disk.
Go read Jonathan Kehayias's blog post on why that counter is useless.That counter being at 100% does not mean that the disks are not being touched. Even if it did, there's still the writing portion of disk usage on data modifications.
Gail Shaw
Microsoft Certified Master: SQL Server, MVP, M.Sc (Comp Sci)
SQL In The Wild: Discussions on DB performance with occasional diversions into recoverabilityWe walk in the dark places no others will enter
We stand on the bridge and no one may pass -
I read Jonathan's article. Disappointing that such a basic counter is suspect. And even though 470GB of memory sounds like a lot, it's only 6% or so of the 6+ TB of data. Management seems convinced that we're safe to proceed with the SSD rollout to production, but this mainly OLTP testing that was done was off the mark. Report queries with lots of IO are our problem.
I suspect if you took out lots of index/statistic maintenance the writes would be lower

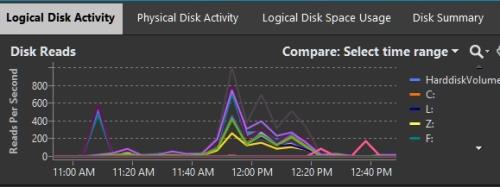
Test environment logical reads during SSD testing window
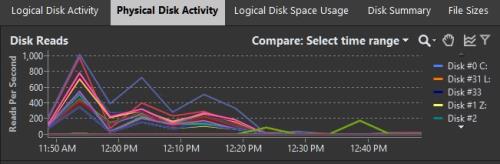
Test environment physical reads during SSD testing window
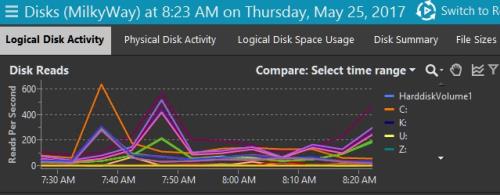
Production logical reads during weekday morning hour
Production Physical reads during weekday morning hour
-
It is so compliated. zskia.dhswz.com
Viewing 8 posts - 1 through 8 (of 8 total)
You must be logged in to reply to this topic. Login to reply