Home Forums SQL Server 2008 SQL Server 2008 Performance Tuning How to check I/O Bottle necks RE: How to check I/O Bottle necks
November 15, 2017 at 12:19 pm
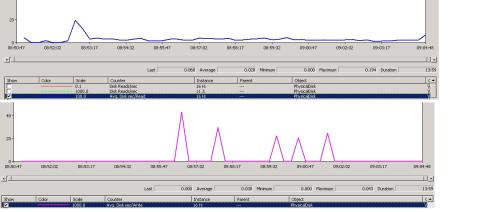
Sue_H - Tuesday, November 14, 2017 6:25 PMvigneshbeece - Monday, November 13, 2017 9:33 PMI have attached perfmon report(SQL server to check disk IO) here for Average disk Sec/Read & Average disk Sec/write.
physical disk. average disk/sec read and write is normal or need to be take steps to fix it.I dont know how to calculate to disk I/O.Please some one can help me. I have attached report.
PerfMon reports on the number of seconds for those disk measurements. A lot of the articles on evaluating those are looking for milliseconds so multiply by 1000 to get milliseconds. Pay attention to whatever measurement is being used for a threshold - seconds or milliseconds.
In PerfMon, it's usually better to just use the average you capture as there will always be some spikes. But sustained spikes would be something to look at.
And then you will find that there are different thresholds or what should be "good numbers" reported by different groups of people. But they are close.
You have averages on those of
.028 seconds or 28 ms
.030 seconds or 30 ms
Those will generally fall in the not too good or bad category. So it's something to look into.You also want to keep in mind that PerfMon is capturing the statistics for the server which can be things other than SQL Server.
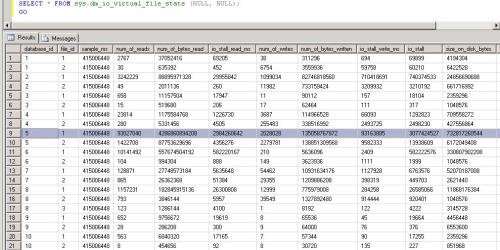
To look at just SQL Server statistics, most people will also look at the DMV sys.dm_io_virtual_file_stats to capture the statistics by database file to get a better idea of where the issues are as that can play a part in how you address it. It usually gives you an idea of where the queries are that need to be tuned.
You can find more information on that DMV in this blog post - and follow the link at the beginning for a script you can use to capture the I/O latencies:
How to examine IO subsystem latencies from within SQL ServerSome of the PerfMon threshold numbers (and the variations) are listed in this article:
Monitoring Read/Write LatencyYou only need to read the first half of the article - the seconds part is promoting a promoting a SQL Sentry product.
But that article will also tell you other things you can look into when you find the disk performance being not too good. It generally comes down to tuning queries, fixing code but if you check some of the other DMVs, that can help you narrow things down, find hot spots, etc. Sometimes it can be hardware or network but more often it will be code. You need to keep an open mind and be receptive to it being anything. Personally I think it's a good idea to look at the query stats when doing this as well but I usually work my way down to that one after capturing the other things mentioned in the articles.
Capturing things from a few different angles helps to prevent missing potential issues contributing to or causing the problems. Things like high latency in Perf Mon but low latency in virtual file stats generally tells you something outside of SQL Server is eating up the disks. I think it's a good practice to just be open minded about what the issues could be and check all the different pieces. Too often we can see something and then assume it is one thing or another (or assume it can't be one thing or another) and incorrectly pursue that path and it ends up being something else we hadn't thought of.
One area of a performance problem doesn't necessarily mean it's that specific area that is deficient or problematic. You may be going to disk a lot and pushing up the I/O and start seeing disk latency. But that may not have anything to do with the disks and the queries may be fine but you don't have nearly enough memory for your workload type.Sue
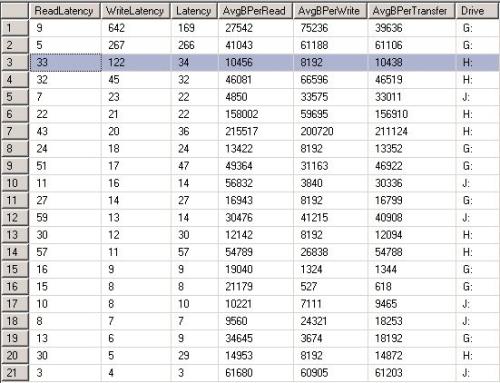
Thanks a lot. I have attached virtual IO file stats report and aggregate information . Can you please check this? I dont know how to analyze this.