performance question about profiler trace
-
I have a problem where one of my procedures is very slow but I struggle to understand one aspect of a profiler trace...
Please see in the attached trace file (I added the .txt extension to be able to attach it and stored it as Zip as well)

In this trace, I catch the end of Batch/Batch Statement/Stored Procedure/Stored Procedure Statement taking more than 0.5 second, as well as recompile events.
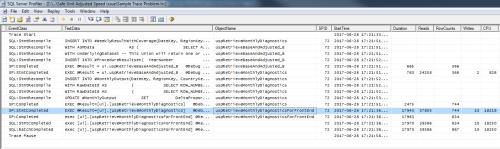
The trace shows a procedure (uspRetrieveMonthlyDiagnostics) being called from within another one (uspRetrieveMonthlyDiagnosticsForFrontEnd)
What puzzles me is that the execution of the inner procedure takes 2.5 seconds according to the SP:Completed event, but the statement of just calling it from within the outer procedure is marked as 18 seconds.
What can explain this huge difference???The recompiles are not too surprising because we use temp table and throw quite a few thousand rows in them.
Right now, it seems to always do that while, in the past, this behaviour seemed erratic.
Any idea?
Thanks
-
I couldn't open your attachment in the profiler. Can you verify your attachment?
I do see the outer procedure has many "reads" than the inner procedure. Are you performing any other logic in the outer procedure besides calling the inner procedure?
thanks!
- sunita2912 - Wednesday, June 28, 2017 10:49 AM
I attached it as Zip.
Maybe it was renaming it as .txt that might have corrupted it in the load?Yes, it does a few other things but nothing that gets caught as a statement. taking over 0.5 second
-
The trace file along with the Execution plan will be more useful to explain your question about the execution time.
But anyway, according to the trace, the procedure is performing 37k+ reads. May be you need to investigate that. Check the execution plan for the Table scans and missing indexes.
Also verify the Index stats.Good luck!
-
My question to this forum is not about removing the performance bottleneck itself but more about understanding how two trace events, supposedly reporting the same thing report two drastically different execution times.
The SP:StmtCompleted highlighted in the screenshot shows 744 rows returned and a number of page reads of 37803 (which is actually not that big) while the event on the line before (SP:Completed) reports the exact same event with still 744 rows but a duration of 18 seconds instead of 2.5.
This is the point I am asking about. How is it possible that the very same event takes 2.5 AND 18 seconds?
PS: the number of page reads seems quite irrelevant because the CPU itself covers the 18 seconds and I would bet it is single threaded.
-
I only noticed now that the statement firing the inner procedure started 15 seconds BEFORE the inner procedure itself started!
Why would that be???
Viewing 6 posts - 1 through 5 (of 5 total)
You must be logged in to reply to this topic. Login to reply