Display Pivot results in Matrix control on report
-
I need to show result set in a report that has a variable number of columns. I am trying to mimic a stock report that is currently done in Excel manually.
I can get the data I need using some dynamic SQL and a PIVOT, but can't figure out how to display it in a report because of the variable columns. The first 2 columns(fldStockAuditCode and FloorStartDate) will always be present, but the product name columns is dynamic and can change.I have tried to unpivot the data and use it to drive a matrix control, but that ends up ignoring records returned will NULL. Is there any other way to achieve this? It seems a bit odd that I would pivot the data then unpivot it to get what I need to drive a report.
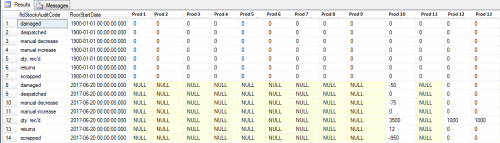
The result set of my pivot is in the screenshot below. I could do it manually by just copy and pasting in to excel, but I want to use these results to drive a report:

-
Then why pivot in the first place? As to eliminating NULL values, any form of aggregation can do that, so the question is what data type does the NULL value represent, and if it's anything in the numeric category, can you live without doing any kind of AVERAGE value, which would be impacted if we substituted 0 for NULLs. Alternatively, if it's a character field, perhaps we can substitute a blank value ('')? Let the reporting tool do what it does best, and see if an alternative data representation can get you where you need to be with respect to rows and columns, and you can always suppress the display of 0's in SSRS. Does that help?
Steve (aka sgmunson) 🙂 🙂 🙂
Rent Servers for Income (picks and shovels strategy)
Viewing 2 posts - 1 through 1 (of 1 total)
You must be logged in to reply to this topic. Login to reply