Trimestrial report build
-
Dear All,
I have a SharePoint 2013 report build with SQL REPORT builder it's display monthly numbers of the requests done withing SharePoint site.
With following quary for month:
- =MonthName(Month(Fields!Created.Value))&" "& Year(Fields!Created.Value)
in dataset query list.I revieved request to add another report to have a trimetrial display every quarter of the year.
Q1 = JAN+FAB+MAR
Q2 = APR+MAY+JUN
Q3 = JUL+AUG+SEP
Q4 = OCT+NOV+DECI have search already and could not scope solution for my request.
Thanks for help
- kokosz008 - Tuesday, June 6, 2017 3:46 AM
It's a bit hard to understand as there isn't much information here - are there existing dates, are you trying to group by quarters, etc.
The closest thing I can think of that may be what you are looking for is that datepart function supports quarter. Maybe using that works for you.Sue
-
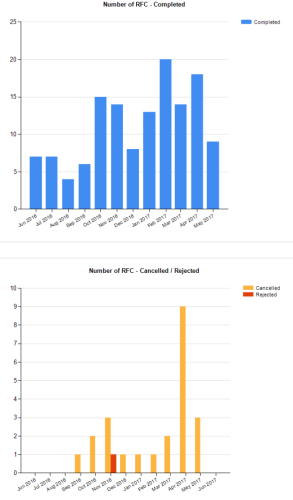
Hello
I'm sorry if I was unclear.
I have a chart:

Which collect information from SQL DB with following query of data set:
- <RSSharePointList xmlns:xsi="http://www.w3.org/2001/XMLSchema-instance" xmlns:xsd="http://www.w3.org/2001/XMLSchema">
<ListName>CAB_CR_Register</ListName>
<ViewFields>
<FieldRef Name="Title" />
<FieldRef Name="Status" />
<FieldRef Name="DateOfApproval" />
</ViewFields>
</RSSharePointList>It contains information about monthly results.
to represent months I am using : =MonthName(Month(Fields!Created.Value))&" "& Year(Fields!Created.Value)And I need to create additional chart which collect information by quorter.
I tried "quarter " option but it does not give correct result.
- What did you try with quarter that didn't work? I think there is a way to do it in the query of the sharepoint list which is what it looks like you are using but I have usually just added fields to those. So if you add a calculated field to the dataset, you could call it Quarter or whatever. Using the same thing you are using to determine month - just add the logic for quarter. So it would be something like:
=iif(month(Fields!Created.Value) >= 1 and month(Fields!Created.Value) <=3,"Q1",
    iif(month(Fields!Created.Value) >= 4 and month(Fields!Created.Value) <=6, "Q2",
        iif(month(Fields!Created.Value) >= 7 and month(Fields!Created.Value) <=9, "Q3","Q4")))
Sue
Viewing 4 posts - 1 through 3 (of 3 total)
You must be logged in to reply to this topic. Login to reply