SQL Counting
-
ServerName Drive %Value ServerA E:\ 21 ServerA E:\ 21 ServerA E:\ 13 ServerA F:\ 12 ServerA C:\ 12 ServerA E:\ 2.4 ServerA E:\ 3 ServerA E:\ 0 ServerA E:\ 0 ServerB C:\ 21 ServerB D:\ 21 ServerB E:\ 13 ServerB E:\ 24 ServerB E:\ 25 ServerB E:\ 9 ServerB E:\ 4 ServerB F:\ 4 ServerB F:\ 5 ServerC F:\ 50 ServerC D:\ 70 ServerC F:\ 90 
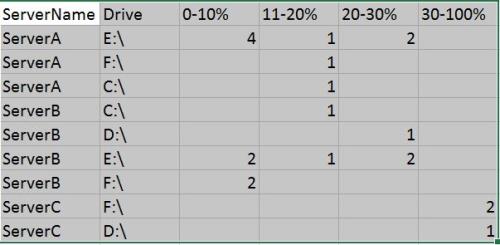
Column Names in select result: [ServerName] [Drive] [0-10%] [11-20%] [20-30%] [30-100%]
For the above values how can depict it in a select statement which provides data as attached.
How to count values between various intervals(4 in here) and count the number of occurences for each drive by server.Thanks
-
Use a CASE statement. For example:
CASE WHEN Value BETWEEN 0 AND 10 THEN 1 ELSE 0 ENDThen use a GROUP BY on your Server Name and Drive and sum your CASE statements. Have a go and if you get stuck show what you tried and we can get you back on track.
Thom~
Excuse my typos and sometimes awful grammar. My fingers work faster than my brain does.
Larnu.uk -
Quick pointer... looks like you want something like a cross tab. See Jeff Moden's article "Cross Tabs and Pivots".
Edit.
Code would probably end up looking something like this:
SELECT ServerName, Drive,
    SUM (CASE WHEN val >= 0 AND val < 10 THEN 1 ELSE NULL END) AS [0-10%],
    SUM (CASE WHEN val >= 10 AND val < 20 THEN 1 ELSE NULL END) AS [10-20%],
    SUM (CASE WHEN val>=20 AND val<30 THEN 1 ELSE NULL END) AS [20-30%],
    SUM (CASE WHEN val>=30 THEN 1 ELSE NULL END) AS [30-100%]
FROM <<tablenamehere>>
GROUP BY servername, drive
ORDER BY servername, drive
Thomas Rushton
blog: https://thelonedba.wordpress.com
Viewing 3 posts - 1 through 2 (of 2 total)
You must be logged in to reply to this topic. Login to reply