Where is that CPU gone? (Profiler Trace)
-
I have a stored procedure (uspRetrieveMonthlyDiagnosticsForFrontEnd) that takes about 6 seconds.
Almost all processing is done through a sub procedure (uspRetrieveMonthlyDiagnostics) that returns a bit of data (~100 rows) to the main procedure through a temp table.
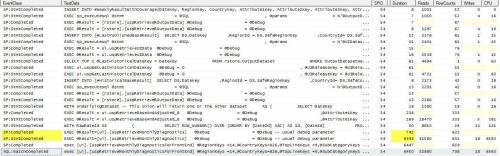
I ran a profiler trace showing BatchCompleted, SPCompleted, StmtCompleted with a filter on duration for 5ms
The trace shows that
- the batch takes 6450ms (mostly CPU)
- the main procedure takes 6447ms
- the statement calling the sub procedure takes 6443m
- BUT the execution of that sub procedure takes only 742 ms!!!
Any idea where that CPU is consumed that is not shown in the trace?
-
My recollection is that Profiler will show the entire batch completion AFTER the completion of all statements in comprises. Thus your statement completed following the sp completed event should be from some other call to it that isn't completed.
Try to capture this a different way: set up your profiler trace so the only filter is the SPID of your SSMS query window you are going to call the driver sproc from. See if that changes things.
I demo this all the time when presenting to show how bad UDFs are and I ALWAYS get the batch completetd after the bajillion individual calls to the UDF.
Best,
Kevin G. Boles
SQL Server Consultant
SQL MVP 2007-2012
TheSQLGuru on googles mail service -
Tried it but does not make a difference to what I see in profiler...
Is there any reason to think I might get a different result from extended events?
I have not investigated these yet... - Eric Mamet - Wednesday, February 15, 2017 5:31 AM
So you are 100% certain that you are seeing your own sproc run and no other? Hmm. If you take out statement completed stuff do you get the right number for presumably one completed event for the sproc?
You can find resources online about switching from profiler to XEs to speed your investigation of this.
I sure wish I had access to your system. There isn't much in the relational engine of SQL Server that I haven't come across in my 20+ years of consulting on the platform. So this one really piques my curiosity! 😎
Let's ask a different question. Does this actually matter for any purpose?
Best,
Kevin G. Boles
SQL Server Consultant
SQL MVP 2007-2012
TheSQLGuru on googles mail service -
>> "Does this actually matter for any purpose?"
Yes, because this stored procedure is used in an Intranet application and it makes the application very slow occasionally.
The trace I shared took about 6 seconds.
I just reproduced it this morning...
I ran the app and the trace showed 7 seconds response time with the same pattern: PS:Completed in ~0.9s while statement calling this proc took 7s...
Running it a second time, same thing: 0.9s / 7sRunning it a third time, it all looks fine: 0.8s / 0.8s...
I have not worked out exactly why/when it misbehaves...
- Eric Mamet - Thursday, February 16, 2017 2:26 AM
Hmm. I wonder if the Heisenberg Uncertainty Principle isn't in play here. Namely, the act of observing something changes what you observe. Tracing statement level completed can add significantly to the duration of the query.
Assuming that isn't it, you don't need profiler anyway. You KNOW you have a "random" performance issue. Go find out why. Most likely cause is data value skew closely followed by one of MANY things that void the acquisition of accurate statistics during optimization. Well, simple locking/blocking too, but I hope you have checked for that using sp_whoisactive or some other means.
Best,
Kevin G. Boles
SQL Server Consultant
SQL MVP 2007-2012
TheSQLGuru on googles mail service - Eric Mamet - Tuesday, February 14, 2017 11:00 AM
Did you check compilation time?
Does that procedure have a lot of dynamic SQL?
Do the statistics on the base tables go outdated quickly (massive data refresh, etc.)?Add "recompile" events to your trace, it might shine some light on the issue.
_____________
Code for TallyGenerator -
Did you check compilation time?
Does that procedure have a lot of dynamic SQL?
Do the statistics on the base tables go outdated quickly (massive data refresh, etc.)?Interesting questions
Yes, there is a fair amount of relatively complex dynamic sql
I tried showing recompilations and there are quite a few but nothing that seemed to justify this sort of delay(?).
There is one main base table but its content does not change quickly.
It contains about 15 million rows organised in batches of ~600,000. Each batch is identified by a "BatchId" which is the first column in the clustered index.
I regularly generate (and later delete) these batches but it is not happening while I am testing the performance of that procedure.How can I evaluate the compilation times?
Viewing 8 posts - 1 through 7 (of 7 total)
You must be logged in to reply to this topic. Login to reply