

Materialized lake views (MLVs) in Microsoft Fabric are an effective way to implement medallion architecture declaratively, but once you have a pipeline of MLVs in production, you need visibility into whether they’re current. Fabric’s MLV management area gives you a visual lineage and refresh history, but if you want to build automated alerting, logging, or custom tooling, you need to get that information programmatically. This post walks through one way to do that, using a small demo lakehouse built entirely in a Fabric notebook.
Getting lineage from table properties
When you create a materialized lake view, Fabric automatically populates a table property called fabric.source.entities that describes every immediate upstream source. You can retrieve it with SHOW TBLPROPERTIES and parse the JSON payload:
props = spark.sql(f"SHOW TBLPROPERTIES dbo.mlvc").collect()
source_entities_raw = next(
    (row["value"] for row in props if row["key"] == "fabric.source.entities"),
    None
)
sources = [e["tableName"] for e in json.loads(source_entities_raw)]
The payload includes workspace, artifact, and schema context for each source, which means it can support cross-lakehouse lineage scenarios as that capability matures. Combining this across all MLVs in a schema, using SHOW MATERIALIZED LAKE VIEWS IN dbo, gives you the full dependency graph without any hardcoding.
Getting last modified time from source tables
If you have Change Data Feed enabled on your base Delta tables (which you should for optimal MLV refresh anyway) you can retrieve the timestamp of the last committed operation from the Delta transaction log:
history = spark.sql(f"DESCRIBE HISTORY dbo.table1 LIMIT 1").collect()
last_modified = history[0]["timestamp"]
DESCRIBE HISTORY returns the full transaction log in reverse chronological order. LIMIT 1 gives you the most recent entry, which corresponds to the last time data was written to the table. This is more reliable than file system metadata because it reflects committed Delta transactions, not just file touches.
Getting last refresh time from an MLV
MLVs are persisted as Delta tables under the hood, so the same DESCRIBE HISTORY approach works for them too:
history = spark.sql(f"DESCRIBE HISTORY dbo.mlva LIMIT 1").collect()
last_refresh = history[0]["timestamp"]
This gives you the timestamp of the last time the MLV was successfully refreshed, whether that was triggered by a schedule, a notebook, or manually from the portal.
Detecting staleness
With timestamps for both sources and MLVs in hand, you can compare them to determine whether any MLV is out of date. An MLV is stale if any of its upstream sources have a newer timestamp than the MLV itself. Staleness also propagates downstream — if mlvb is stale, then mlvc which depends on mlvb is also stale regardless of its own source timestamps. From there you can write results to a Delta table for historical tracking, feed them into an alerting pipeline, or visualize them inline in the notebook.
Visualizing dependencies in the notebook
Once you have the lineage graph and timestamps as Python objects, you can render an interactive dependency diagram directly in a Fabric notebook cell using displayHTML. Rather than building the diagram from scratch, I used vis.js, a JavaScript network visualization library that loads directly from a public URL at render time with no package dependencies to manage.
vis.js handles node layout, edge routing, and interactivity out of the box, which makes it a practical choice for notebook-based visualization. The diagram is built by serializing the Python lineage dict and timestamp dict to JSON, injecting them into an HTML string, and passing that to displayHTML. vis.js renders a hierarchical left-to-right layout that mirrors data flow direction, with each node labeled with the object name and its last modified or last refresh timestamp. Nodes are color-coded by type — green for base Delta tables, blue for MLVs — and when staleness detection is enabled, any node that needs a refresh turns orange, as do the edges feeding into it. The resulting diagram is interactive — nodes can be dragged to reposition them, the canvas can be scrolled to zoom, and hovering over a node highlights it and its connected edges, which is useful when tracing dependencies in a more complex pipeline.
One thing worth noting: I attempted to use matplotlib first, which is natively available in Fabric notebooks, but I ran into limitations with arrow routing that made the diagram hard to read when nodes were at different vertical positions. vis.js solved that cleanly without any additional setup, as long as the CDN is accessible from your Fabric capacity.
Walkthrough
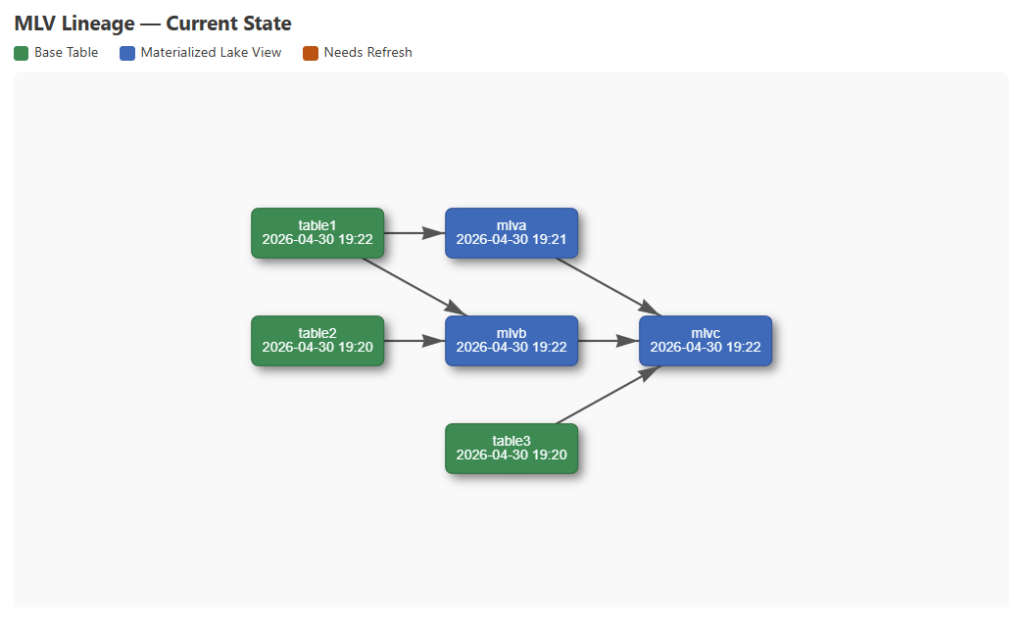
To demonstrate this end to end, my notebook sets up three base Delta tables and three MLVs with the following dependencies:
- mlva is sourced from table1
- mlvb is sourced from table1 and table2
- mlvc is sourced from mlva, mlvb, and table3
Change Data Feed is enabled on all three base tables so the Delta transaction log captures each write, and CDF is set on the MLVs as well so incremental refresh is available. After setup, the notebook refreshes all three MLVs in dependency order — mlva and mlvb first, then mlvc — to get a clean baseline. You could also refresh them from the Materialized lake views tab on the Lakehouse item in the Fabric portal.
With everything refreshed, parsing fabric.source.entities and DESCRIBE HISTORY across all objects gives us the full lineage graph and a timestamp for every node. At this point nothing is stale, and the baseline diagram reflects that:
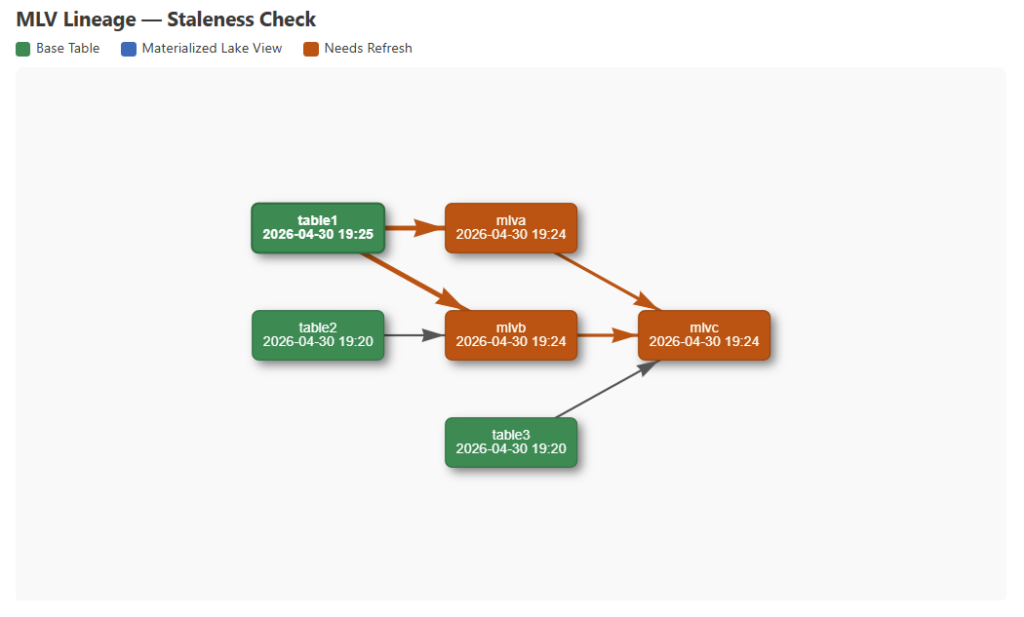
Next, three new rows are inserted into table1. That single write makes table1 newer than mlva, mlvb, and mlvc — all three depend on table1 either directly or through a dependency. Re-fetching timestamps and running the staleness check propagates that through the graph, and the updated diagram highlights all affected nodes:
The Fabric portal already gives you a visual lineage and refresh history for MLVs, but doing this programmatically means you can build on top of it — logging refresh state over time, triggering alerts when MLVs go stale, or embedding a live diagram in an operational notebook. The full notebook is available in my GitHub repo.
What would you do with programmatic access to MLV lineage and refresh state? Let me know in the comments.
The post Programmatically Retrieving MLV Lineage and Refresh Times first appeared on Data Savvy.