

In the era of cloud-native applications, Kubernetes has become the default standard platform for running containerized workloads. While Kubernetes is one of the best orchestration tools, it also presents a bit of challenges. Managing costs is one of the challenges; unchecked resource consumption in a dynamic Kubernetes environment can lead to spiralling cloud bills. This is where FinOps, a discipline that combines financial accountability, engineering, and operations to optimize cloud spending, without compromising on delivery or performance, can be useful. It also enables users to gain visibility into making informed decisions and implementing automation to optimize costs.
Kubernetes is one of the best orchestration tools; it possesses several capabilities that make it a very robust and reliable tool, including the ability to auto-scale applications during off-peak or low-peak periods, load balancing, and the ability to adapt to run ephemeral workloads.
In this article, you will explore how to use three open-source tools: OpenCost, KubeGreen, and Kubecost, which can help you to implement effective FinOps practices in Kubernetes environments.
Why is FinOps Critical for Kubernetes
Before diving into solutions, it’s essential to understand why Kubernetes cost management is uniquely complex.
Shared Resources: One of the key advantages of using Kubernetes is the fact that you can share infrastructure resources and prevent waste. However, this presents a challenge: how to fairly allocate the cost of a node that runs pods from different departments or teams. How do we bill each department for their infrastructure cost?
Resource Abstraction: Kubernetes simplifies infrastructure management by abstracting the underlying complexity. However, this makes it challenging to determine the application cost, as a single node can host multiple pods from different teams or environments.
Dynamic Resource Allocation: Kubernetes simplifies infrastructure management, making it easy for teams to consume compute resources — sometimes too easily. Without clear visibility and governance:
- Non-production (Development and staging): These are environments that are left running 24/7.
- Idle workloads silently consume budget.
- Compute resources can be over-provisioned.
- Costs quickly escalate, especially in multi-cloud or multi-tenant setups.
FinOps practices provide financial accountability and tooling to:
- Track resource consumptions in real time
- Optimize resource utilization
- Attribute costs accurately to teams, services, or applications.
Prerequisite for setting up FinOps ToolKit
- A running Kubernetes cluster (EKS is used in this guide).
- Helm CLI is installed on your local workstation.
- Have a storage class of “gp3” created in your Kubernetes cluster.
- kubectl access to your cluster
The FinOps Toolkit: OpenCost, KubeGreen, and Kubecost
OpenCost is an open-source project initially developed by Kubecost, and it is now a sandbox project with the Cloud Native Computing Foundation (CNCF). OpenCost was built for Kubernetes, but it is not limited to Kubernetes. It provides a standardized way to monitor Kubernetes resources in real-time. For more information about OpenCost, check https://opencost.io/
How it works:
- Cost allocation: OpenCost tracks and allocates costs down to the Kubernetes workload level, including deployments, namespaces, and pods. It provides a granular breakdown of your cloud bill.
- Resource metrics: It uses Prometheus to scrape resource usage metrics (CPU, memory, etc) and combines them with cloud provider pricing data to give you a clear picture of what each workload is costing you.
How to Set Up OpenCost:
Before setting up OpenCost in your Kubernetes cluster, you need to have a running Kubernetes cluster.
Step 1: Install Prometheus (required):
OpenCost relies on Prometheus scraping cluster metrics (node metrics, kube-state-metrics, container metrics). The easiest path is to install kube-Prometheus using the Prometheus community Helm chart, which includes Prometheus Server, node-exporter, kube-state-metric,s etc.
Use the following command to install prometheus helm chart:
# install prometheus
helm install prometheus prometheus-community/kube-prometheus-stack
  --namespace prometheus
  --set prometheus.prometheusSpec.storageSpec.volumeClaimTemplate.spec.storageClassName=gp3
  --set prometheus.prometheusSpec.storageSpec.volumeClaimTemplate.spec.resources.requests.storage=5Gi
  --set prometheus-pushgateway.enabled=false
  --set alertmanager.enabled=false
  -f https://raw.githubusercontent.com/opencost/opencost/develop/kubernetes/prometheus/extraScrapeConfigs.yaml
This will install Prometheus in the prometheus namespace. To confirm that the pods and pvc are running in the prometheus namespace, run the command below.
kubectl get pvc -n prometheus
NAME                                                                                                     STATUS   VOLUME                                     CAPACITY   ACCESS MODES   STORAGECLASS   VOLUMEATTRIBUTESCLASS   AGE
prometheus-prometheus-kube-prometheus-prometheus-db-prometheus-prometheus-kube-prometheus-prometheus-0   Bound    pvc-45faf60b-acf4-4450-8dc4-c98995ee1a0f   5Gi        RWO            gp3            <unset>                 96s

kubectl get pods -n prometheus
NAME                                                   READY   STATUS    RESTARTS   AGE
prometheus-grafana-55b6967ccd-txbhc                    3/3     Running   0          100s
prometheus-kube-prometheus-operator-6576f48bf4-xp8st   1/1     Running   0          100s
prometheus-kube-state-metrics-6c644c75f-f7f79          1/1     Running   0          100s
prometheus-prometheus-kube-prometheus-prometheus-0     2/2     Running   0          97s
prometheus-prometheus-node-exporter-bttfv              1/1     Running   0          100s
prometheus-prometheus-node-exporter-pv5p6              1/1     Running   0          100s
Step 2: Install OpenCost
a. Create a namespace for OpenCost with the command below:
kubectl create namespace opencost
b. Add the OpenCost Helm repository with the command below:
helm repo add opencost https://opencost.github.io/opencost-helm-chart
helm repo update
C. Install OpenCost via Helm
Install OpenCost and link it to your Prometheus instance with the command below.
helm install opencost opencost/opencost
  --namespace opencost
  --create-namespace
  --set opencost.prometheus.internal.serviceName=prometheus-kube-prometheus-prometheus
  --set opencost.prometheus.internal.namespaceName=prometheus
  --set opencost.prometheus.internal.port=9090
You need to specify the following parameters of your Prometheus configurations, So that OpenCost can scrape the necessary information.
Breakdown of these flags:
- opencost.prometheus.internal.serviceName: Prometheus service name
- opencost.prometheus.internal.namespaceName: Prometheus namespace
- opencost.prometheus.internal.port: Prometheus service port (default is 9090)
Below command shows that OpenCost in running successfully in the OpenCost namespace.
kubectl get pods -n opencost
NAME                        READY   STATUS    RESTARTS   AGE
opencost-856b599d7f-pl2h6   2/2     Running   0          21h
d. Access the OpenCost UI
In a production environment, you need to create an ingress to access the OpenCost UI but in this example we will be using port-forward to access the OpenCost UI through your local machine.
Firstly check the the service of OpenCost UI by running the command below.
kubectl get svc -n opencost
NAME       TYPE        CLUSTER-IP     EXTERNAL-IP   PORT(S)             AGE
opencost   ClusterIP   10.100.88.64   <none>        9003/TCP,9090/TCP   23h
Secondly, port-forward the OpenCost UI service to your local machine.
kubectl port-forward svc/opencost -n opencost 9090:9090
You will have the result below after running the port-forward command above.

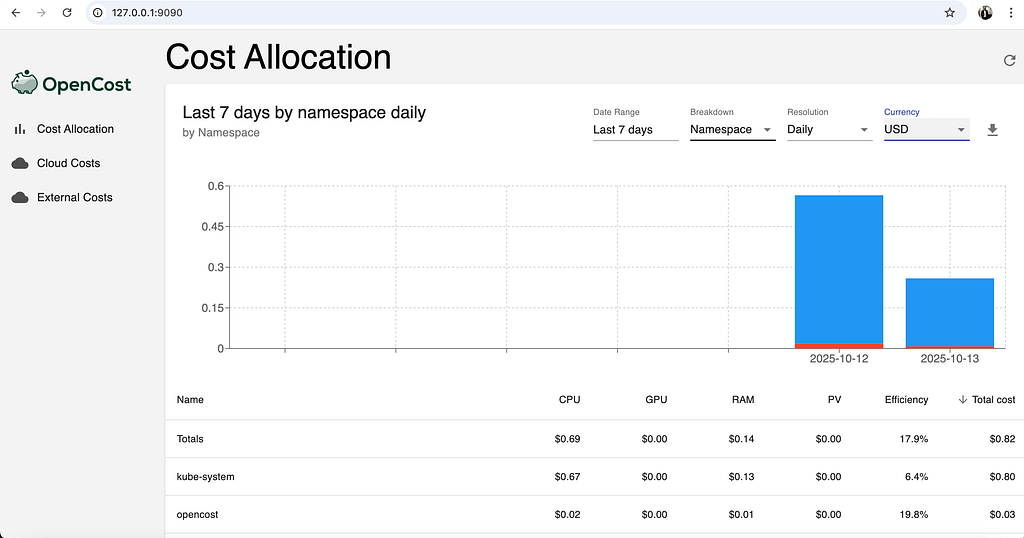
Then open: http://localhost:9090 on your browser
The OpenCost UI shows the cost of running workloads and infrastructure resources in a Kubernetes cluster. You can filter the cost allocation by namespace, cluster, pod, or service by selecting an option from the ‘Breakdown’ dropdown to view detailed infrastructure costs.
Let's explore KubeGreen, which is another FinOps Toolkit used in this blog.
KubeGreen is an open-source project that helps reduce Kubernetes cluster costs and carbon footprint by automatically scaling down or stopping non-critical workloads during off-hours (e.g., nights, weekends, or holidays). It is ideal for development and staging environments where workloads do not need to run 24/7.
For more information about KubeGreen, visit https://kube-green.dev/
How KubeGreen works:
- Sleep Mode / Schedule: KubeGreen lets you define sleep schedules for namespaces or deployments, or pods. When the schedule starts, it automatically scales down deployments, Statefulsets, and cronjobs in those namespaces.
- Wake Up: When the schedule ends, KubeGreen scales the workloads back to their original state.
- Zero Config Changes: It doesn’t require changing application manifests. Instead, you can annotate namespaces or resources with schedule labels.
- Cost Saving: By stopping workloads when not needed, you reduce cloud spend and energy usage.
How to Set Up KubeGreen:
Before setting up KubeGreen, ensure you have met all the requirements outlined in the prerequisite section.
Step 1: Install Cert Manager first
Cert manager is a prerequisite that is required for kubeGreen. KubeGreen uses webhooks and controllers to put workloads (like Deployments, StatefulSets, CronJobs) to sleep or wake them up based on schedules. To do this securely in Kubernetes, it exposes a webhook server inside the cluster.
a. Add and update the cert-manager Helm repo:
helm repo add jetstack https://charts.jetstack.io
helm repo update
b. Install cert-manager (with CRDs):
helm install cert-manager jetstack/cert-manager
  --namespace cert-manager
  --create-namespace
  --set installCRDs=true
c. Verify that cert-manager is running
After installing cert-manager, wait a few seconds, then confirm using the command
kubectl get pods -n cert-manager
kubectl get pods -n cert-manager

NAME                                     READY   STATUS      RESTARTS   AGE
cert-manager-cainjector-869db6c5-zfpk9   1/1     Running     0          16m
cert-manager-f7bb45cbd-8h9bw             1/1     Running     0          16m
cert-manager-startupapicheck-sqbxk       0/1     Completed   0          16m
cert-manager-webhook-59cd649868-p2z4z    1/1     Running     0          16m
Step 2: Install KubeGreen with Helm
a. Install KubeGreen
helm repo add kube-green https://kube-green.github.io/helm-charts/
helm repo update

helm install kube-green kube-green/kube-green --namespace kube-green --create-namespace
This will deploy KubeGreen controller in the kubegreen namespace.
b. Verify the Installation
Check that the KubeGreen pods are running:
kubectl get pods -n kube-green

NAME                                             READY   STATUS    RESTARTS   AGE
kube-green-controller-manager-7b86c77c44-jqlqv   1/1     Running   0          37s
c. Annotate a Namespace with a Sleep Schedule
For example, to stop workloads in the dev namespace from 8 PM to 8 AM UTC every day:
# Create a dev namespace for testing
kubectl create namespace dev

# Deploy a sample application (optional, for demonstration)
kubectl create deployment nginx --image=nginx --replicas=3 -n dev

# Now annotate the namespace
kubectl annotate namespace dev
  kubegreen.dev/sleep-at=20:00
  kubegreen.dev/wake-up-at=08:00
  kubegreen.dev/timezone="UTC"
What happens:
- At 20:00 UTC: KubeGreen scales down Deployments, StatefulSets, and CronJobs in the dev namespace.
- At 08:00 UTC: KubeGreen scales everything back up to its previous state.
You can confirm the annotation:
kubectl describe namespace dev

Name:         dev
Labels:       kubernetes.io/metadata.name=dev
Annotations:  kubegreen.dev/sleep-at: 20:00
              kubegreen.dev/timezone: UTC
              kubegreen.dev/wake-up-at: 08:00
Status:       Active
When the sleep time starts:
- All targeted workloads in the namespace will be scaled down to 0.
- KubeGreen stores the original replica count in annotations.
When the wake-up time hits:
- Workloads are scaled back to their original replica count automatically.
Why Use KubeGreen
- Cost Optimization: Save money by turning off non-critical resources when not needed.
- Sustainability: Reduce energy usage and carbon footprint.
- Easy to Use: No need to modify existing manifests, just annotate namespaces or use a CRD.
Let's explore Kubecost, it is another FinOps Toolkit used in this blog.
Kubecost is a popular FinOps (Financial Operations) tool that provides real-time cost visibility and governance for Kubernetes clusters. It gives platform and application teams insights into who is spending what, and helps optimize workloads to reduce cloud costs.
For more information about Kubecost, visit https://github.com/kubecost
Kubecost offers:
- Real-time cost allocation by namespace, pod, deployment, service, cluster, label, etc.
- Cost optimization recommendations (idle resources, right-sizing, over-provisioned resources).
- Multi-cluster support and RBAC.
- Support for spot instances, on-demand, reserved instances/committed use discounts, and custom pricing.
How to Set Up Kubecost:
Before setting up Kubecost, ensure you have met all the requirements outlined in the prerequisite section.
Step 1: Install Kubecost with Helm
a. Add the Kubecost Helm repository and install:
helm repo add kubecost https://kubecost.github.io/cost-analyzer/
helm repo update

helm install kubecost kubecost/cost-analyzer
  --namespace kubecost
  --create-namespace
  --set persistentVolume.storageClass=gp3
  --set persistentVolume.size=32Gi
  --set prometheus.server.persistentVolume.storageClass=gp3
  --set prometheus.server.persistentVolume.size=32Gi
b. Verify that the Kubecost resources are running:
kubectl get pods -n kubecost

NAME                                          READY   STATUS    RESTARTS   AGE
kubecost-cost-analyzer-57c6c598f8-spml7       4/4     Running   0          2m52s
kubecost-forecasting-66c8fc4b94-7bvqb         1/1     Running   0          2m52s
kubecost-grafana-5f5447b984-wlcmb             2/2     Running   0          2m52s
kubecost-prometheus-server-65b9ddd57d-dxrxv   1/1     Running   0          2m52s


kubectl get svc -n kubecost

NAME                         TYPE        CLUSTER-IP       EXTERNAL-IP   PORT(S)             AGE
kubecost-aggregator          ClusterIP   10.100.90.189    <none>        9004/TCP            3m32s
kubecost-cloud-cost          ClusterIP   10.100.10.183    <none>        9005/TCP            3m32s
kubecost-cost-analyzer       ClusterIP   10.100.12.40     <none>        9003/TCP,9090/TCP   3m32s
kubecost-forecasting         ClusterIP   10.100.146.165   <none>        5000/TCP            3m32s
kubecost-grafana             ClusterIP   10.100.223.214   <none>        80/TCP              3m32s
kubecost-prometheus-server   ClusterIP   10.100.44.11     <none>        80/TCP              3m32s
c. Access the Kubecost UI
In a production environment, you need to create an ingress to access the Kubecost UI, but in this example, we will be using port-forwarding to access the Kubecost UI through your local machine.
You can access Kubecost via port-forwarding (good for dev/test):
kubectl port-forward --namespace kubecost deployment/kubecost-cost-analyzer 9091:9090
Then open: http://localhost:9091 on your browser
You will get a screenshot similar to this. The dashboard will show:
- Cluster cost overview
- Recommendation for right-sizing and savings

Conclusion
In this article, we explored how to implement FinOps practices in Kubernetes using three powerful open-source tools: OpenCost, Kubecost, and KubeGreen.
We explored how OpenCost provides real-time cost visibility at the workload level, giving teams a granular view of resource consumption. Kubecost is a commercial platform (with a free tier) built on OpenCost, which adds enterprise features such as multi-cluster management, advanced reporting, cost optimization recommendations, budget alerts, and dedicated support. With KubeGreen, we learned how to save costs and reduce carbon footprint by automatically scaling down or pausing non-critical workloads during off-hours.
Together, these tools give Kubernetes users the ability to:
- Track costs in real time across clusters, namespaces, and workloads
- Receive actionable optimization recommendations and right-sizing suggestions
- Implement automated cost-saving measures without disrupting production workloads
- Gain insights into infrastructure cost across teams, applications, and clusters.
By combining visibility (OpenCost), intelligence (Kubecost), and automation (KubeGreen), these tools form a comprehensive FinOps toolkit for Kubernetes. Whether you’re running a single cluster or managing multiple environments, this combination empowers teams to make informed decisions, control cloud spending, and maintain financial accountability, without compromising application performance.
FinOps for Kubernetes doesn’t have to be complex; these tools make cost efficiency achievable, measurable, and sustainable.
![]()