

Introduction
This article can be considered the second part of my previous article, Tips to optimize your SQL Statements. This time I'll be focusing more on specific data warehouse (DWH) optimization techniques, including database and server instance settings.
Although an SQL Statement is always the same format whether executed against an OLTP database or against a DWH, the scope of the query can differ quite a bit between the two topologies. In an OLTP system, the norm of the queries are short/fast queries that will return a row or two, utilising a small number of processor cores. However in a DWH, reporting queries may span a large number of huge tables (both row size and storage) and return a huge dataset utilizing larger number of processor cores..
Where to start?
OK, so let's assume that all the previous tips that I mentioned in my previous article have been followed, mainly:
- All the neccessary indexes are in place.
- All statistics are updated.
- Fragmentation is minimum.
- There are no excessive locks which are actually preventing the SQL statements from running.
- The hardware is adequate for the database being hosted.
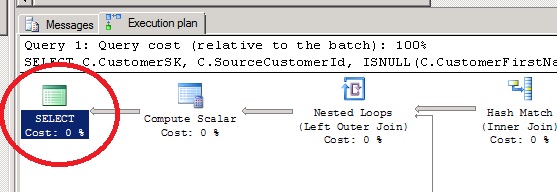
..... and still there are SQL statements which are taking very long to execute. These SQL statements can be ad-hoc statements as fired by the developers, SSRS reports or an SSAS cube being processed. The next logical step is to follow what is happening under the bonnet, i.e. what execution path the optimizer is choosing to retrieve the data for the identified slow running queries.
I normally use this SQL query below to identify the slowest queries.
SELECT TOP 10
SUBSTRING(qt.TEXT, (qs.statement_start_offset/2)+1,
((CASE qs.statement_end_offset WHEN -1 THEN DATALENGTH(qt.TEXT)
ELSE qs.statement_end_offset
END - qs.statement_start_offset)/2)+1) As SQLStatement,
qs.execution_count,
qs.total_logical_reads,
qs.last_logical_reads,
qs.total_logical_writes,
qs.last_logical_writes,
qs.total_worker_time,
qs.last_worker_time,
qs.total_elapsed_time/1000000 total_elapsed_time_in_Sec,
qs.last_elapsed_time/1000000 last_elapsed_time_in_Sec,
qs.last_execution_time,
qp.query_plan
FROM sys.dm_exec_query_stats qs
CROSS APPLY sys.dm_exec_sql_text(qs.sql_handle) qt
CROSS APPLY sys.dm_exec_query_plan(qs.plan_handle) qp
ORDER BY qs.total_worker_time DESC -- CPU time
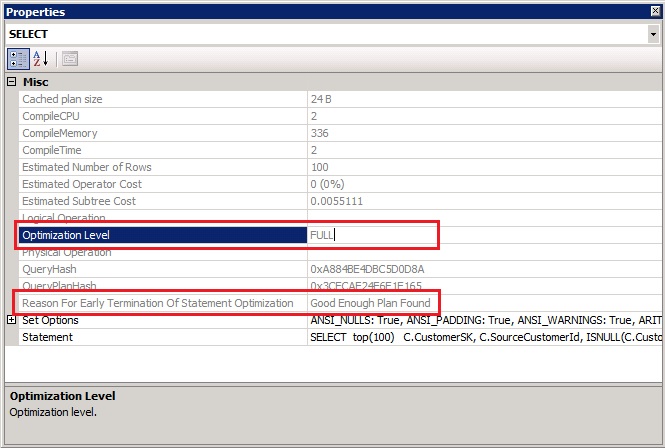
In the example below, a FULL optimization was performed and a Good enough Plan was found. This means that the optimizer thanks to the statistics, found a plan which will seem to perform well.
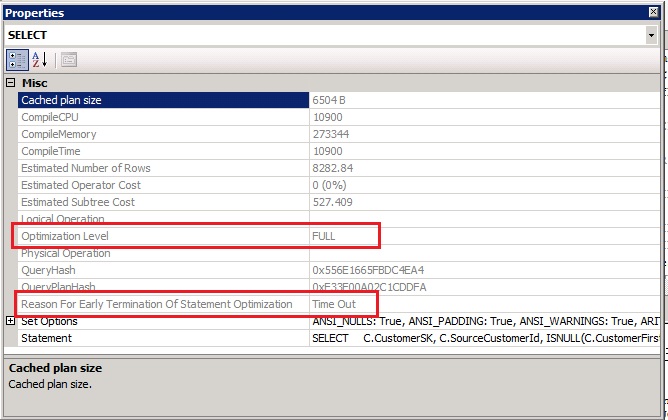
However in the example below, the optimizer just stopped looking for a good plan simply because it ran out of options. Does this mean that the plan selected is not good? Not really! It just means that there can be other more efficient ways to retrieve the data, and this is something that is up to us at this stage.
So what next?
The optimzer is a great piece of software (and it has been further improved in SQL Server 2014), but it is not infallible. It works on a pre-defined set of rules in a specific short time, and in fact, that's why the time-out occurred! It's impossible for the optimizer to go through all possible permutations in a short period of time. The more tables being selected and joined, the more different permutations available.
Simplify the SQL Statement.
Well, it is easier said than done, to simplify your SQL. However in most of the cases this is possible with some tweaks.
I'll refer to a data warehouse on which I used to work. As with many DWHs, it consisted of a customer dimension table. This dimension is a wide table, 80 columns, 50 of which have foreign keys to other dimension tables. A section of the customer metadata is detailed below:
CREATE TABLE [dbo].[DimCustomer](
[CustomerSK] [int] IDENTITY(10,1) NOT NULL,
[BrandFK] [tinyint] NOT NULL,
[ApplicationFK] [tinyint] NOT NULL,
[SourceCustomerId] [int] NOT NULL,
[CustomerFirstName] [nvarchar](100) NULL,
[CustomerLastName] [nvarchar](100) NULL,
[Username] [nvarchar](200) NULL,
[Email] [varchar](800) NULL,
[SiteFK] [smallint] NOT NULL,
[CountryFK] [smallint] NOT NULL,
[LanguageFK] [smallint] NOT NULL,
[AddressFK] [int] NOT NULL,
[BirthDate] [date] NULL,
[CurrencyFK] [tinyint] NOT NULL,
[RegisterDateFK] [int] NOT NULL,
[Gender] [char](1) NOT NULL,
[FirstDepositDateFK] [int] NOT NULL,
[SecondDepositDateFK] [int] NULL,
[CustomerStatusFK] [tinyint] NOT NULL,
[CustomerSegmentFK] [tinyint] NOT NULL,
..
..
..
Each customer is linked to a language dimension, a country dimension, an address dimension etc... and the list goes on for another 50 dimensions. To be accurate, most of the foreign key are to the DimDate dimension on the DateSK column.
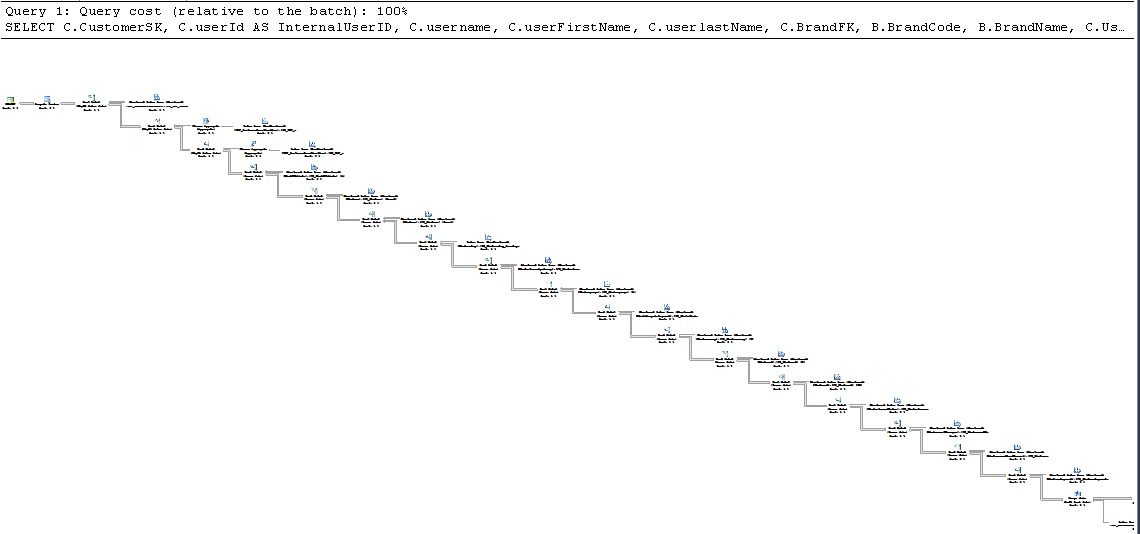
The screeshot below is displaying part of the execution plan which Timed out. I had to Zoom Out quite a bit to capture a good portion of the plan on screen. Obviously it's unreadable but I'm just displaying it to demostrate the Timed Out scenario.
There is more than one option to simply an SQL statement. In the example below, I'll be talking about a Customer dimension with about 2 million rows.
The first option is to split the query in smaller queries, so if the original query was linking 50 tables through FKs, you can stage the query. For example, the original query can be first split into two smaller physical tables and then a query to join and return the final result set. Going back to my original Customer dimension example, I first created another Customer Physical table with all Dates resolved to their proper date values. Then another query was created on top to return the remaining columns. All this can be easily controlled through either a stored procedure or as part of the ETL through SSIS.
At first glance, this option might seem a lot of work. However if the query needs to be optimized, then the extra steps/SQL are always worth the effort & time. It is always recommended to optimise queries which are mostly used!
The second option is to use table and query hints. Although this option does not actually simplify the statement, it does simplify the job of the optimizer since we're now forcing the optimizer to go through the query using a specific path. This will also reduce the number of possibilities that the optimizer has to go through and by just supplying a table hint (in some cases, just one table hint is enough), the Timed Out problem will be solved.
Columnstore Indexes
Introduced in SQL Server 2012 and further improved in SQL Server 2014, columnstore indexes are available. Their main use is to improve the performance of data warehouses. I have detailed in this article the prons and cons of column store indexes vs row store indexes.
Compression
Compress your tables and Indexes. A good article comparing the compression types and its benefits can be found here. From my experience, there are more advantages than disadvantages when compressing indexes for a data warehouse.
Partitioning
Partition your tables. Although partitions will greatly improve maintenance of your database/tables since SQL Server will only be working on a subset of data, partitions may also improve query performamce. The latter is not guaranteed so it's always best practice to partition huge fact tables.
Database Settings
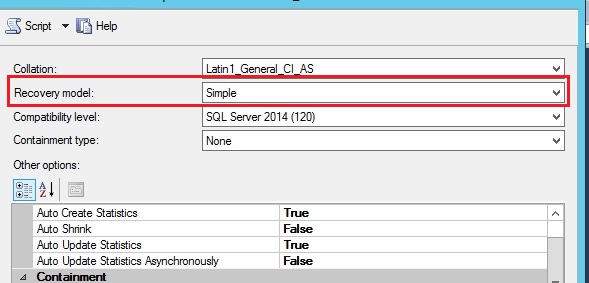
Change the recovery model of the data warehouse to Simple. Although this setting won't improve read performance, i.e. SELECTS, it can improve DML operations especially Bulk Imports using bcp or Bulk Inserts (which can be a common task on loading a data warehouse).
Since a data wahouse is normally updated daily during non-office hours, and its data is reproducible from the source, the standard operation is to first take a full backup before the ETL begins, and then maybe take another FULL backup once the ETL has finished. Therefore, frequent log backups are normally not needed in a DWH enviroment.
Instance Settings
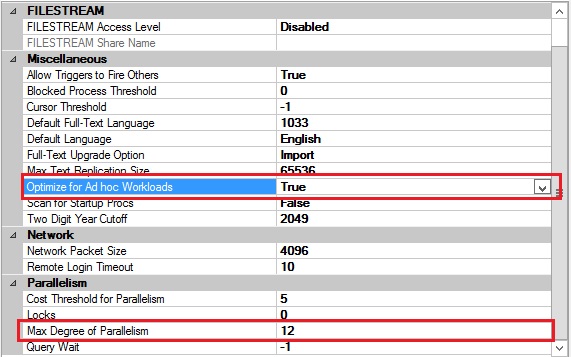
You can change the Optimize for Ad hoc Workloads to True.This setting will not have a direct performance impact on SELECTS, however it will improve the efficiency of the plan cache thus relieving the server from excessive memory pressure.
You can also change the Max Degree of Parallelism. By default, SQL Server will use all processors (as long as it qualifies) to process a query. Having a long running query clogging all CPU cores will have a negative impact on other SQL statements which will be running at the same time. I have always set the Max Degree of Parallelism to half the number of cores of the hardware being used (to start with) and then I monitor my statements (for excessive cxpacket waits and adjust as neccessary) There is always the option to specify a different MAXDOP for specific operations such as specific Select Statements, Index creation or rebuilds etc.
Conclusion
I hope that through this article I have given you some helpful tips to optimse and speed up your SQL statements.
References
Inside the Query Optimizer by Benjamin Nevarez
SQL Server Execution Plans, Second Edition, by Grant Fritchey
Demonstrating the Effects of Using Data Compression in SQL Server by Derek Colley
A closer look at CXPACKET wait type in SQL Server by Matteo Lorini

