

This is Chapter 7 of my Data Mining articles. If you want to see the earlier chapters, you can read the previous articles in this series using the links below:
- An introduction to data mining
- Decision trees
- Clusters
- Naïve Bayes
- Neural Network
- Time series
The new algorithm name is Microsoft Association. This algorithm is very popular in Web Pages to guess the customer preferences based in the articles that the customer buys. It helps to offer extra products, guessing the customer needs.
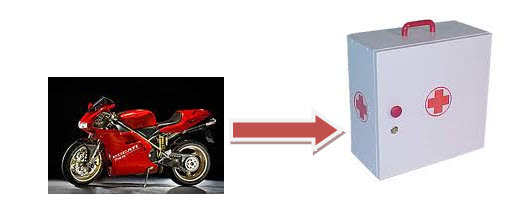
As the name says, it associates items. The Microsoft Association algorithm is used to predict and detect the customer behavior. A good example of association is the motorcycle and the first aid kits. If you buy a motorcycle you will certainly need the first aid kit for accidents. And that is what the experts on marketing want to find with Data Mining. Patterns, rules to predict the customer needs and with that information, we can create plans to improve sales.
The diapers and beer data mining is an urban legend?
Another typical example is the example of beer and diapers. People say that it is an urban legend. I really liked the example and if it is not real, at least is a didactic example for understanding the use of data mining.

This is the legend: Once upon a time there was a super market chain named WalMart. Everybody lived happy there, but once they wanted to improve the sales and they were studying the customer behavior. Using Data Mining, they found that the men usually bought diapers and beer on Friday nights.
Diapers and Beer? "What is the relationship?", they asked themselves. After studying the data, they found that new parents did not have time to go to the disco and pubs, and that's why they replaced their party Fridays with beer. What about the diapers? They were new parents with babies.
As a result, it is alleged that Walmart stocked the diapers next to the beer, resulting in increased incomes for Walmart. Walmart earn more money and everybody lived happily ever after. They did not use Microsoft Association for the Analysis, but they could have used to find these type of patterns.
Amazon samples
You could also add to your web page, a nice suggestion based on knowledge of Data Mining. Amazon is a nice example of an intelligent and dynamic web page. Have you seen this message a in amazon.com?
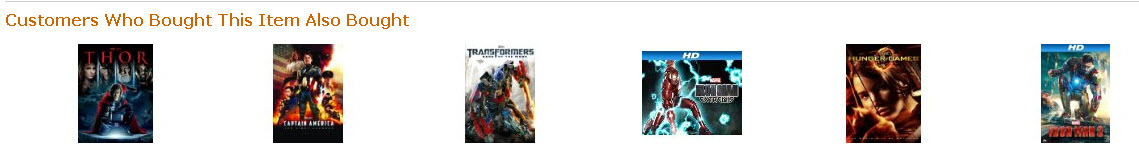
Well, in few words, association rules can detect customers preferences in a web page.
Requirements
For this example, I am using the Adventureworks Multidimensional project and the AdventureworksDW Database. You can download the project and the database here:
http://msftdbprodsamples.codeplex.com/releases/view/55330
Getting started
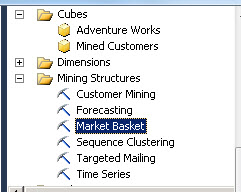
How to create this algorithm? Well, it is a little bit different that other algorithms. If you only want to watch the already created sample in Adventureworks just open the project and go to the Solution Explorer. The name of the sample is Market Basket:
You can explore the Market Basket there:
However, in this tutorial I will teach you to create the project from almost zero. I will use Adventureworks to create a new Data Source View first. Let's start.
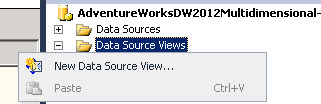
We are going to create a new data source View for this example. In the AdventureworksDW2012 database, go to Data Source Views. Right click in data Source View and select the New Data Source view option.
A Data Source view Wizard, will be displayed. Click Next.
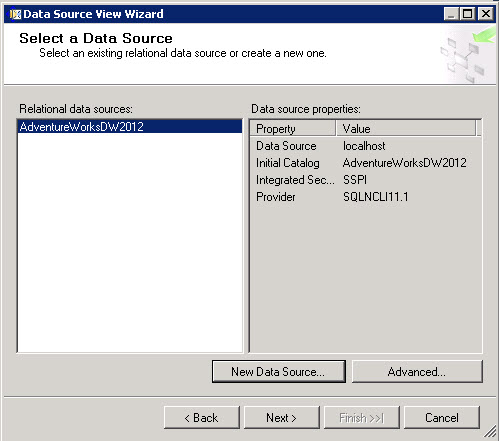
Select the data source and click Next.
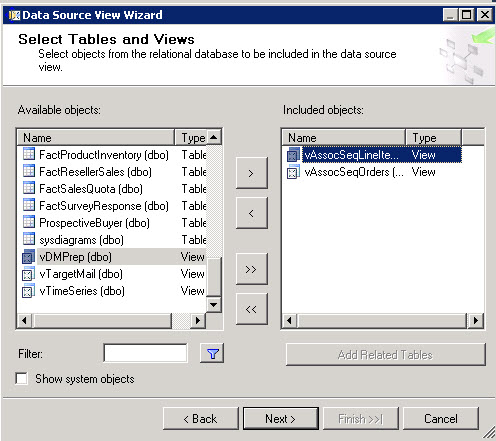
Select the tables and views to be used. In this case, we need two views. The vAsscSeqLineItems and vAssocSeqOrders. We will talk a little more about these views later. Click Next.
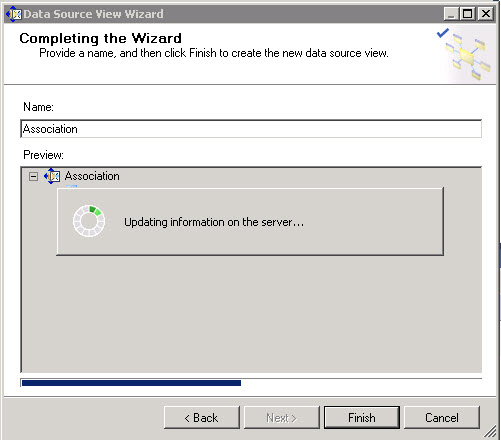
Create a name for the Data Source view. In this example we will call it Association. Click Finish.
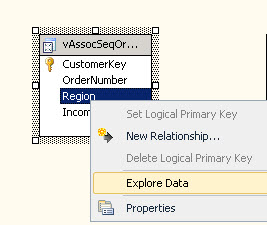
So far, there is nothing special in the steps, except that it requires different views than other algorithms that we saw before. Let's Explore the Data of some Views. In the datasource view, select the vAssocSecOrder right click on it and select the Explore Data option:
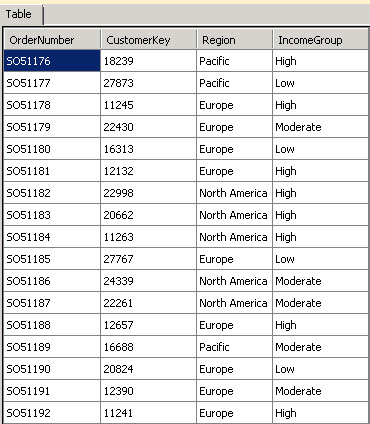
The table contains the OrderNumber, which is the order code. We also have the CustomerKey which contains the Id of the customer. The Region and the IncomeGroup which are related to the region of the orders and the groups of the customers related to the incomes.
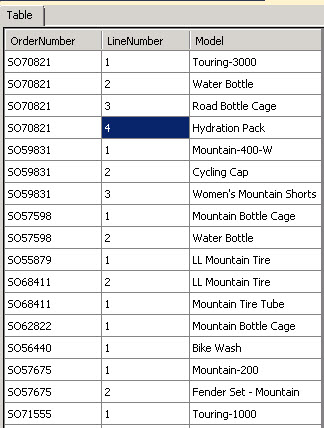
The vAssocLineItems view contains also the OrderNumber, the line number, and the Model. Here you have the detail of the orders. A customer can have one order or multiple orders. Here it is valuable information that we need for our algorithm. We predict results based on this information because we can see items bought by customer with similar preferences. If we analyze multiple customers we can find some patterns.
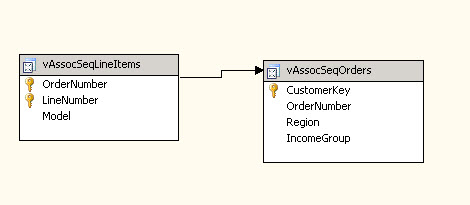
Create a relationship between vAssocSeqLineItems and vAssocSeqOrders. Select the OrderNumber from vAssocSeqLineItems and drag it to vAssocSeqorders.
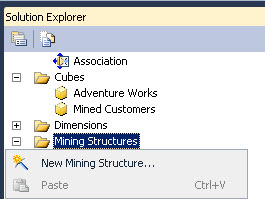
Now we need a new Mining Structure. In the Solution Explorer, right click in the Mining Structures right click on it and select New Mining Structure.
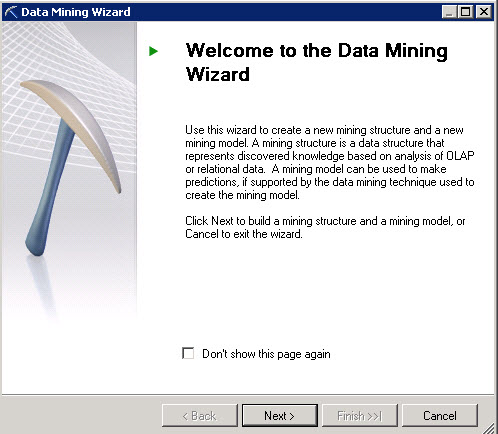
A welcome wizard will be displayed. Click Next.
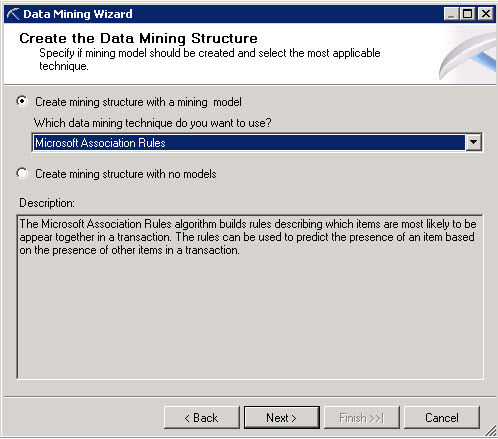
Select the option from Existing relational Database or data warehouse. In the Create the Data Mining Structure Window, in the data mining technique, select Microsoft Assotiation Rules.
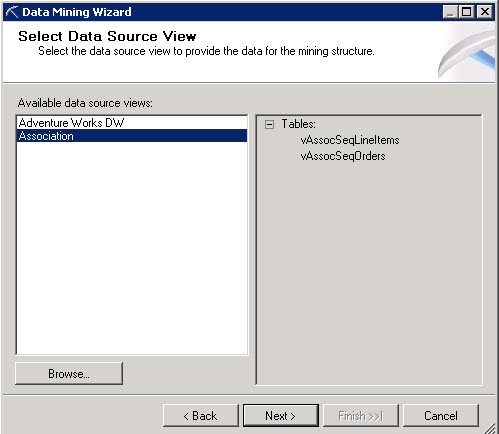
In the Select Data Source View, select the Data Source View created above. In this example, it is Association.
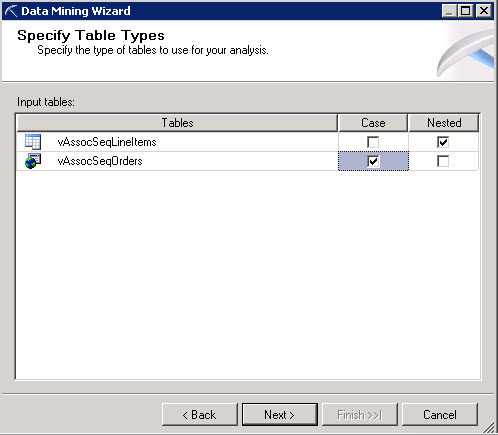
This part is important and different than other Data Mining Models. You have to specify which table is a case and which one is nested. A nested table is a table that contains multiple rows of information about a single row. In this scenario, the vAssocSeqOrders contains orders and in the vAssocSeqLineItems we have multiple rows of infomation about these orders. In this scenario vAssocSeqLineItems is nested and vAssocSeqOrders is a Case.
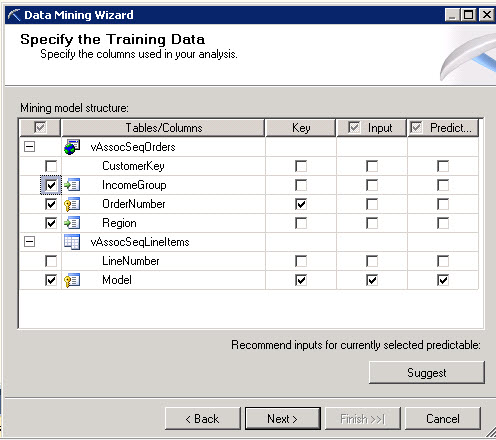
In the Specify the Training Data window, select the options like the following image:
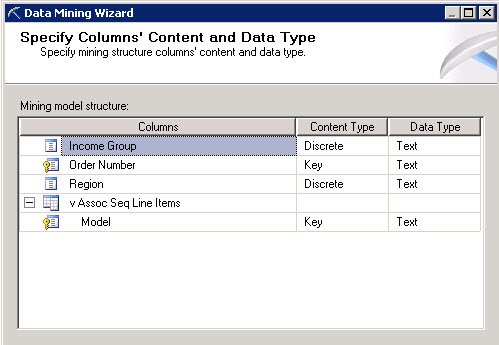
In the Data Type Windows leave all the default values and click Next.
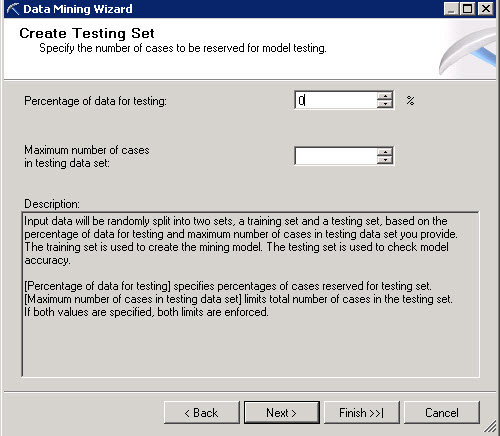
In the percentage of data for testing 0.
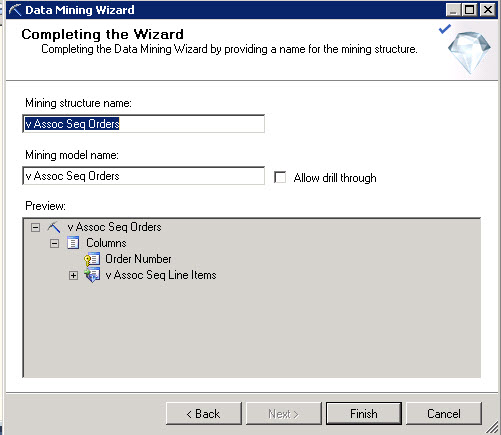
Specify a name for the Mining structure and model or leave the default ones and press Finish.
Go to the Mining Model Viewer, you will receive a message to do a process Full.
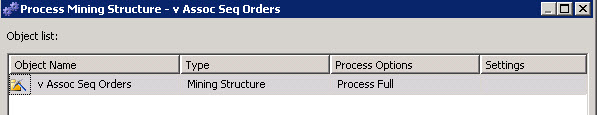
Once processed the Mining Model, you will be able to see something similar than this:
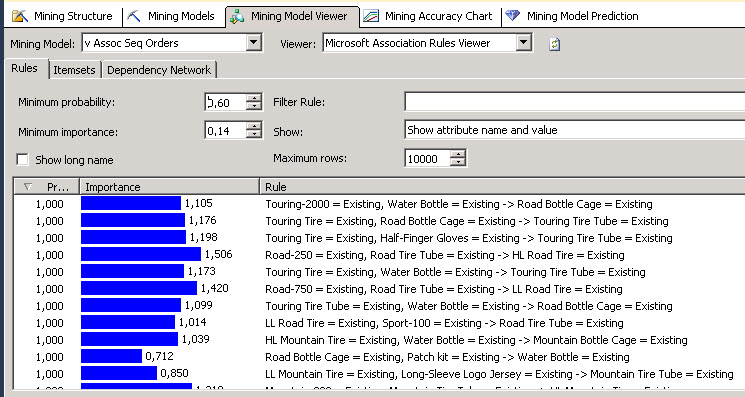
Let's analyze the information. The Touring-2000 bike is bought and we see all the people who buy the Touring-2000, also buy the water bottle and the Road Bottle cage. As you can see this amazing algorithm finds great patterns.
The same for the Touring Tire. People who buy a touring Tire, also buy the Road Bottle Cage and the Touring Tire.
If we move to the Itemset we can also find some information: The Support, size and the Itemset. It is the information related to each item in the orders. The support is the number of orders of each item. As you can see, the Sport-100 and the Water Bottle are really popular items.
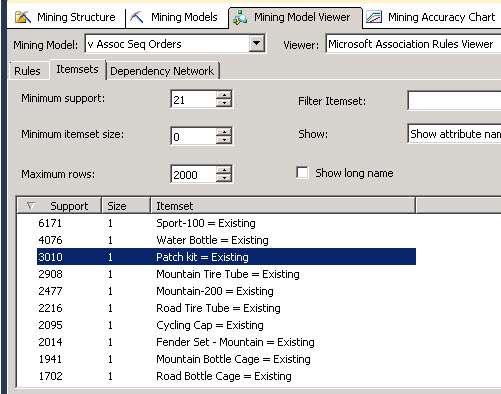
The Size is the number of items in the itemset. Let's order by size:
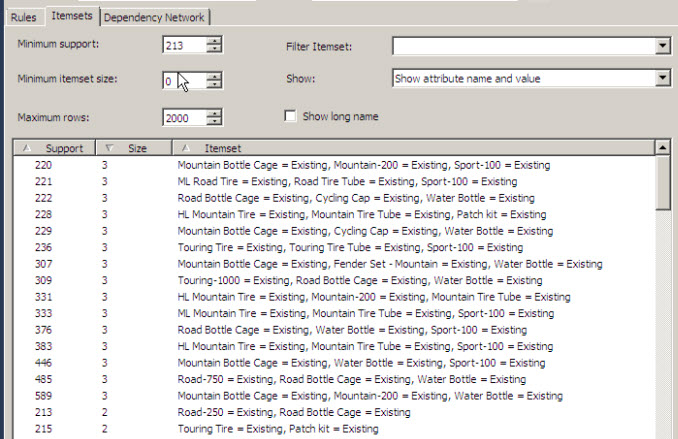
As you can see in the picture, there is a list of items and the support number. For example you know now that there were 220 orders of Mountain bottle Cages and the same customers also ordered a Mountain-200 and a Sport-100.
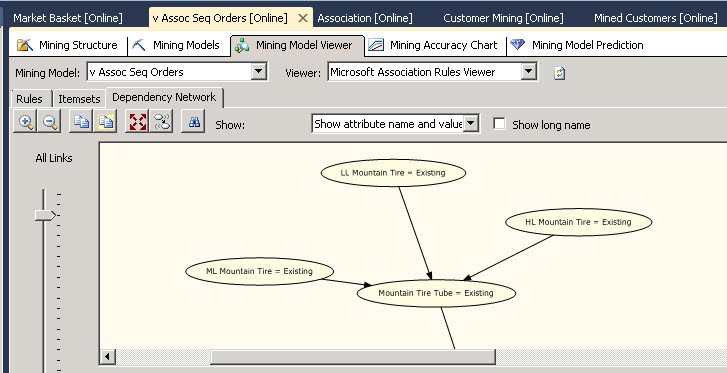
There is also the dependency Network. It displays the relationship between different items.
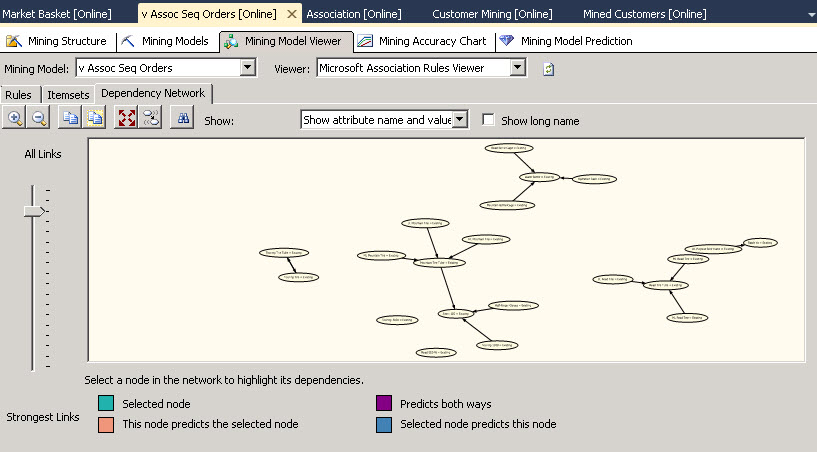
It shows a graphical relationship between items.
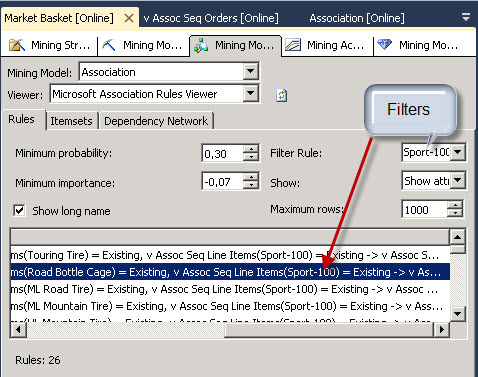
You can also create filter rules, for example filter to only show reports related to the Sport-100 item.
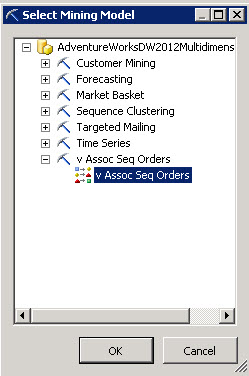
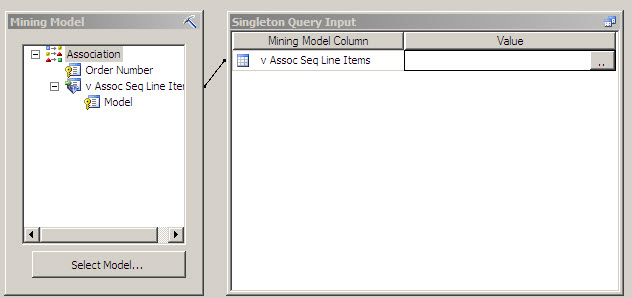
Finally, we will create some queries, go to the Mining Model Prediction Tab and in the Mining Model, select a model.
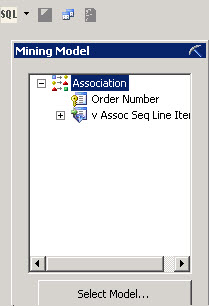
Select the Model created above and press OK.
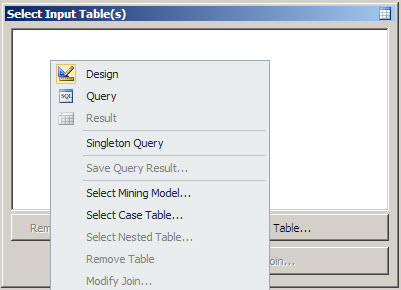
Right click on the select Input Table and select Singleton Query.
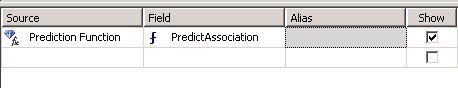
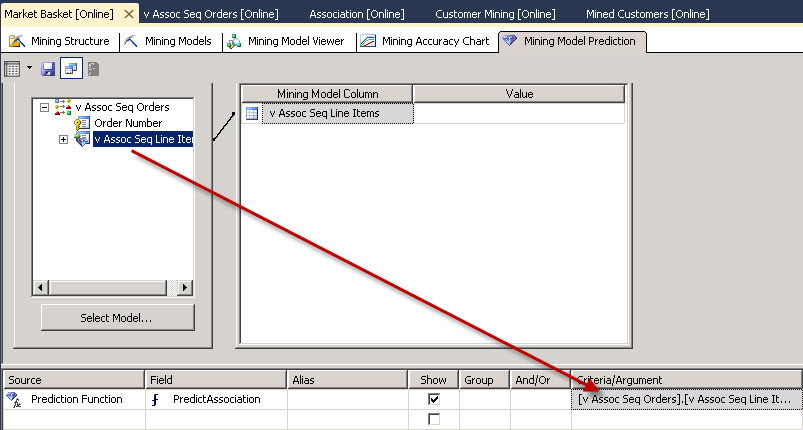
In the source section, select Prediction Function and the select the Predict Association Function. This is a specific function related to Association and we will use for the first time.
Drag and drop the v Assoc Seq Line Items to the Criteria/Argument field.
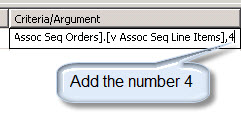
Add a ,4 at the end of the text in the Criteria/Argument field.
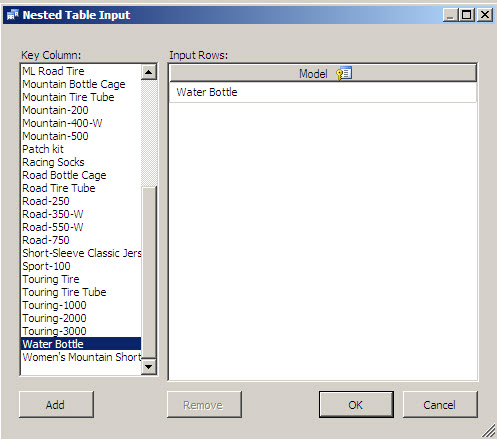
Now in the Singleton Query input click the .. button.
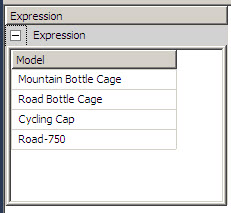
In this example, we are going to analyze 4 products related to the Water Bottle product. Select it and add it. Press OK.
Now watch the results.
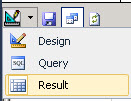
You can now watch 4 products related to the bottle water
As you can see, the association rules algorithm shows you great information about which products can be sold together. It can also be used in other areas to find relationships.
I hope you enjoyed this demo.
Images
References