
Level 7: Working with the SQL Server Agent Job Activity Monitor
In the previous levels of this Stairway, you created and configured SQL Server Agent jobs. Each job has one or more steps, and as you saw in the previous article, may include a significant amount of workflow. In this article, the Job Activity Monitor will be examined. The Job Activity Monitor is the system administration tool to run jobs, view job history, and enable/disable jobs. This article will also review some of the stored procedures run by the Job Activity Monitor that you can also use directly to do your own custom job monitoring.
SQL Server Agent Job Activity Monitor
The SQL Server Agent job activity monitor is the primary mechanism to monitor jobs as they run, as well as review past runs of SQL Server agent jobs. The Job Activity Monitor is a separate dialog, launched from within SQL Server Management Studio. The Job Activity Monitor uses system stored procedures and system tables to display SQL Server Agent job status.
Using the Job Activity Monitor
To examine the Job Activity Monitor for yourself, start SSMS, and navigate to the SQL Server Agent node in Object Explorer. You should see the Job Activity Monitor, as shown in Figure 1. Note that highlighting or single-clicking on the Job Activity Monitor will have no effect, because the Job Activity Monitor is a separate dialog that isn’t shown inside of the SSMS interface itself. Once you’ve either double-clicked on the Job Activity Monitor, or right-clicked on the menu item and selected View Job Activity, you will see the Job Activity Monitor launched. You will notice that the title also contains the server name that was used for the connection in SSMS, in my case “(local)” was used (as shown in Figure 2).
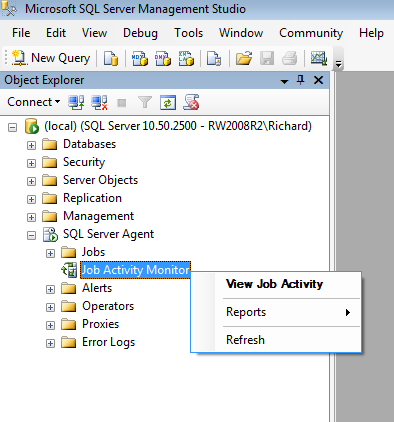
Figure 1: Launching the Job Activity Monitor
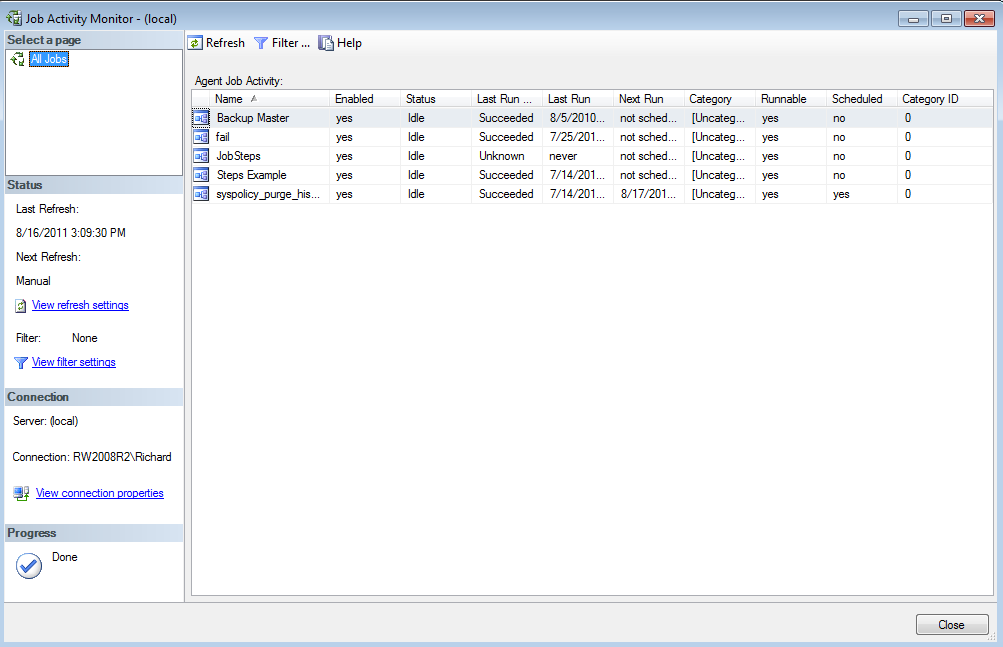
Figure 2: The Job Activity Monitor dialog
You will see an entry in the Agent Job Activity section of the dialog for each SQL Server Agent job defined in this instance of SQL Server. In one easy to view dialog, you can see which jobs are enabled, whether they have run recently, whether the job is currently running, whether the last run was successful or not, and when the job is next scheduled to run if it’s a regularly scheduled job. If your job is categorized, the category is also shown.
Each column in the Agent job activity is sortable – simply click on the name of the column. For example, one thing you might want to do is sort the jobs by job category. Job category is a topic we haven’t covered yet, so we’ll briefly explore creating and specifying job categories.
Job Categories
Job Categories are mostly useful as a way to group jobs together in the Job Activity Monitor. There are a number of built-in job categories for system jobs/tasks. You can also create your own job categories, which you will do now. Switch your focus back into SSMS, right-click on the Jobs folder, and select the option to Manage Job Categories. This will launch the Manage Job Categories dialog, as shown in Figure 3.
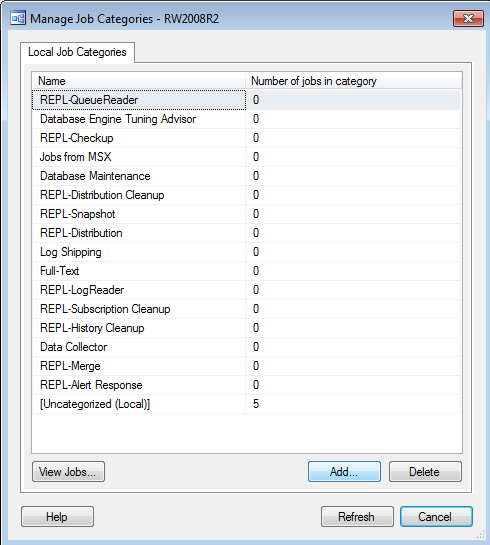
Figure 3: Manage Job Categories
Click on the Add… button to create a new job category. Name your job category (“backups” is the first one to create for this example, then click on the “Show all jobs” checkbox to list your current SQL Server Agent jobs. Check the Backup master job, as shown in Figure 4. You can also edit the properties of a job later and assign a job category.
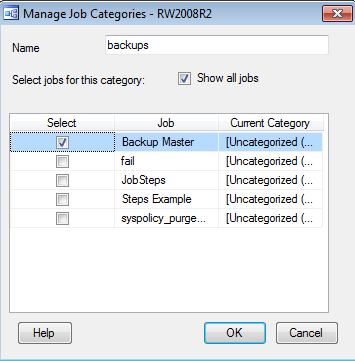
Figure 4: Create a new job category and assign a job to it
Click Add again, and add a second category, named “Examples”, and select the other example jobs you have created from this Stairway. Click OK, then click Cancel to close the dialog (Don’t worry, it won’t undo the work, it’s simply the label on the button that closes the Manage Job Categories dialog).
Filtering with the Job Activity Monitor
Now that you have some interesting data to filter and sort by, re-open or tab back to the Job Activity Monitor. If you click on the “Category” title in the grid, you will now see that the jobs are sorted by your newly created categories (as shown in Figure 5).
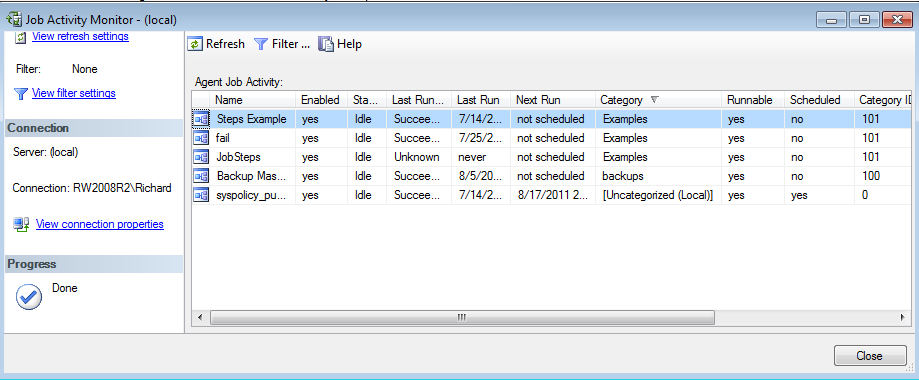
Figure 5: Sorting by Job Category
You can sort by any of the columns displayed, but as you add more jobs the dialog can overwhelm you with information, and it will become more difficult to find the jobs you’re looking for.
At the top of the dialog, you have the option to refresh the dialog, or you can filter. If you have a hundred jobs or more (I know of many DBAs with that many jobs), you will likely want to use the Filter Settings dialog to restrict the jobs that you view. Click on the Filter… button, and will see the standard Filter Dialog for SSMS. Type in “backups” in the Category field (shown in Figure 6), and click the “Apply filter” checkbox at the bottom of the dialog. Click OK, and you will see Figure 7, showing just the jobs with a category of “backup” assigned to them.
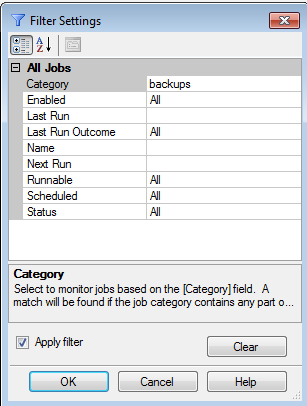
Figure 6: Filtering in Job Activity Monitor
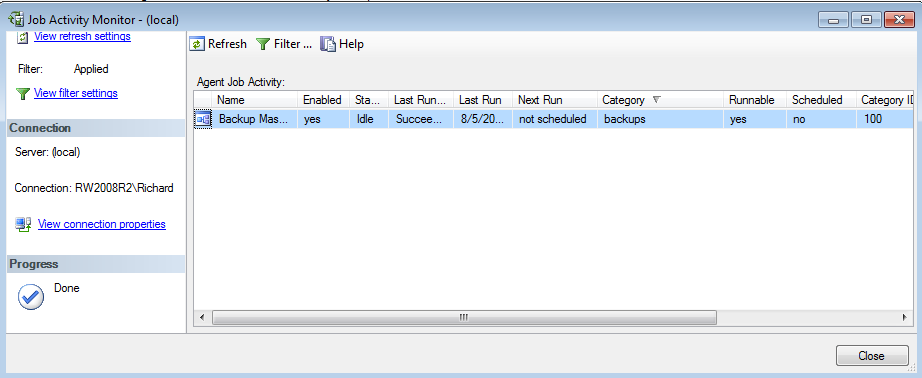
Figure 7: Filtering view applied in Job Activity Monitor
Notice that on the left side of the dialog, you will see that a filter has been applied. If you wish to see all of your jobs again, you must click again on the Filter… button and uncheck the “Apply Filter” option.
Using the job activity monitor to actively monitor jobs
You can also set up the Job Activity monitor to automatically refresh, so you can be on the lookout for failed jobs. While in the Job Activity Monitor, click on the hotlink to “View Refresh settings”, and you will see the dialog for Refresh settings as shown in Figure 8. In this example, check the option box to auto-refresh, and then change the seconds from the default of 60 down to 30 (the appropriate number will vary depending upon what you’re monitoring).
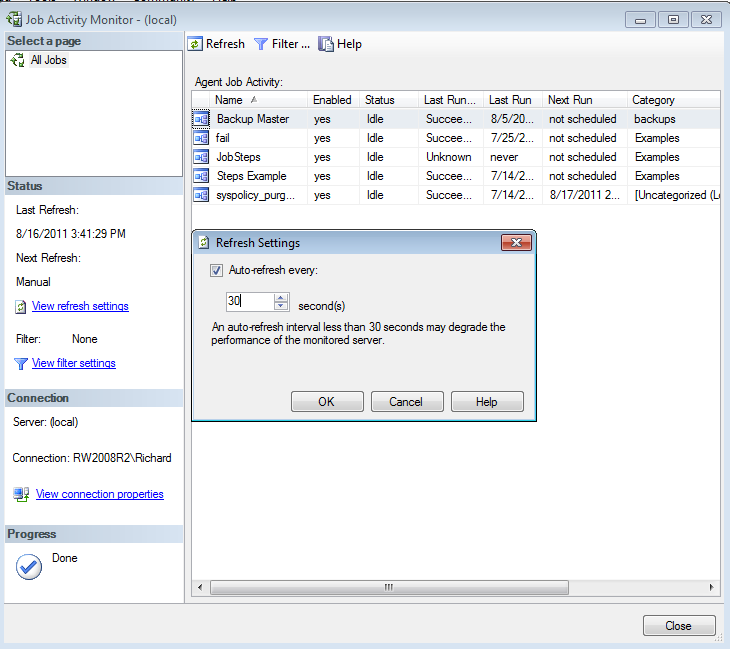
Figure 8: Setting up Auto-refresh for Job Activity Monitor
Click OK, and now the dialog will auto-refresh itself every 30 seconds. Now, combine that with a filter or a sort on Last Run Outcome, and it becomes very easy to watch for failed jobs.
Finally, if you wish to manage a job (i.e. enable, disable, run the job, or modify the job properties), simply right-click on the job in the job list of the job activity monitor. These are the same options covered in earlier SQL Server Agent steps articles, so won’t be covered again.
System Tables and Stored Procedures supporting the Job Activity Monitor
Under the covers of the job activity monitor are some system tables and several system stored procedures. Each time SQL Server Agent starts, it inserts a new row into the msdb.dbo.syssessions table, recording the date/time that SQL Server Agent was started, and a “session_id.” Each time the service is started, a snapshot of a list of all of the SQL Server Agent jobs that exist when the service was started is inserted into the msdb.dbo.sysjobactivity table. That table is used to record information that you saw in the Job Activity Monitor, such as when the job was last run, when the job is next schedule to be run. Additionally, a pointer to the job history (job_history_id column) that points to the job history recorded in msdb.dbo.sysjobhistory is kept here.
Additionally, the view you see in the Job Activity Monitor also includes information gathered from other system tables such as msdb.dbo.sysjobs, msdb.dbo.sysjobsteps, and some extended stored procedures such as master.dbo.xp_sqlagent_enum_jobs. All of these table and procedure accesses are wrapped in a simple call from the job activity monitor to the system stored procedure msdb.dbo.sp_help_job.
If you wish to monitor your jobs but are not in a position to use SSMS, you can simply run sp_help_job. Better yet, if you want to see how things are going, you could create a job to mail the results of running sp_help_job to your cell phone.
What’s Next
SQL Server Job Activity Monitor allows you the flexibility of a graphical interface to monitor job activity and job progress. You can sort, categorize, and filter your jobs to make it easier to monitor the job activity that is interesting to you at any given moment. You can also run the system stored procedures used by the Job Activity Monitor if you’d rather not use the graphical interface.
In our next level, we will examine how to use external programs with SQL Server Agent, for example to shell out to a command prompt or PowerShell and run commands through the operating system.