Red Gate Software commissioned Brian Kelley to write a review of SQL Response and offered Brian a trial version of the software. Brian gives his thoughts on SQL Response version 1 below.

Red Gate's SQL Response is advertised as a low-impact SQL Server monitoring application with an intuitive interface. As a DBA and server administrator I'm always on the lookout for tools that will do a good job of keeping an eye on my myriad of servers and alert me to problems, hopefully before the end user notices. As an infrastructure architect I'm looking for simple solutions which have low impact to my production applications. Given the advertising, I signed up for the SQL Response Release Candidate and took a look. I was pleasantly surprised with what I found.
The User Interface and Viewing Alerts
I'll start with the user interface because quite frankly, it doesn't matter how well a tool performs if it's impossible to get at the information. The user interface for SQL Response is simple, clean, and can be understood at a glance. Figure 1 shows the client dashboard which serves as the control center for seeing and exploring alerts.

Figure 1
Starting in the upper left-hand corner, the interface shows a list of servers as well as "blocks" to show the status of those servers. A close-up is shown in Figure 2.

Figure 2
This allows a quick look by the DBA to see if there is a server which needs checking out. A red block, meaning a high alert, is one a DBA obviously wants to investigate further. Also, should a server show a database with an "x," that means the SQL Response agent wasn't able to contact the server. So not only is there a red block to flag a DBA's attention, but there's an icon change as well. The color convention for the alerts are:
- Red - High
- Yellow - Medium
- Blue - Low
- Purple - Not an alert. SQL Response has a recommendation for that server.
Should you not be interested in monitoring a particular server at the time (for instance, you know a server is down for maintenance), you can click on it in the window and SQL Response won't report on it. Also, if there are certain events you don't want to display, below the list of servers are the lists of events to show on the dashboard. They can be unchecked as well. For instance, if you don't make much use of SQL Server Agent, you can uncheck it and SQL Response will not display it. SQL Response will still monitor for the event, although this can be configured to be off via a template.
The top right-hand panel displays the list of alerts. If desired, these alerts can be grouped by server as well. Figure 3 shows the alerts listed in the normal view (ungrouped).

Figure 3
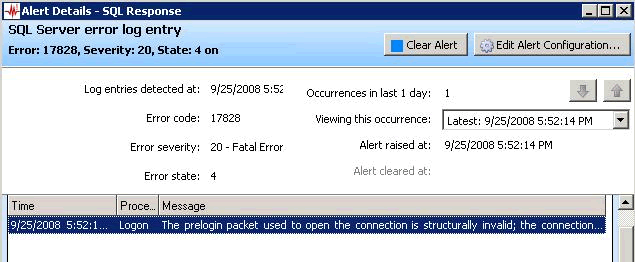
Select the appropriate alert and SQL Response provides the relevant information about the alert (Figure 4). It also can provide information on what else was running on the server and what the processor and memory utilization looked like at the time the event occurred (Figure 5). There is also the capacity to answer (clear) alerts, but this is basically an open text field that's stored in the repository along with the user who cleared the alert and the time when the alert was cleared.

Figure 4

Figure 5
Setting Up Templates for Alerting
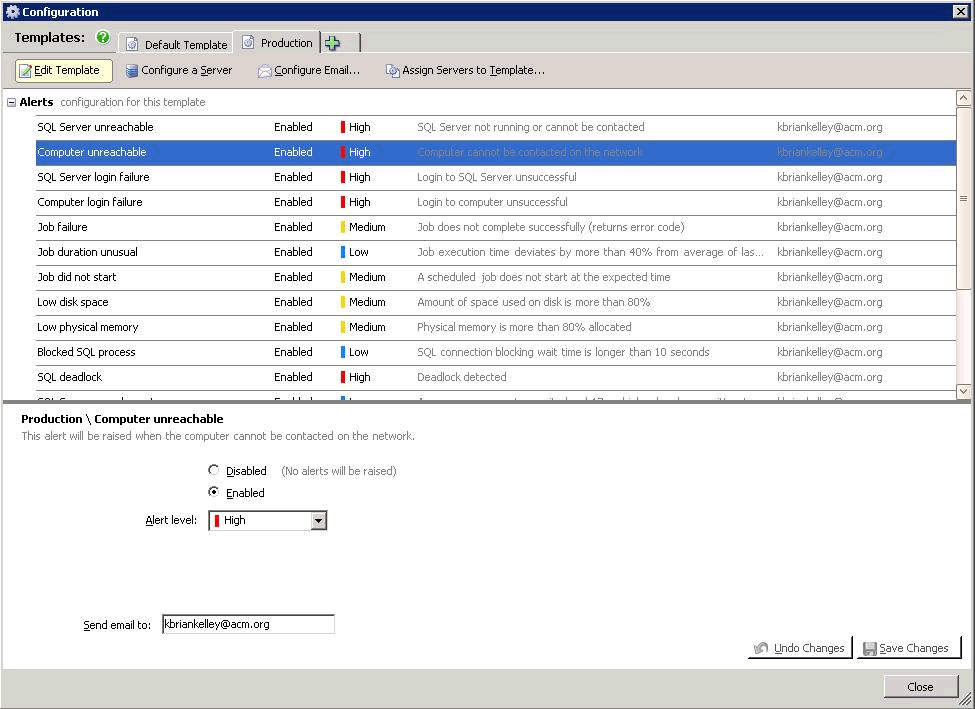
While I've covered some of the customization, SQL Response offers more than what is available on the dashboard. It provides the capability of building templates which you can assign to servers. These templates determine what alerts you're interesting in monitoring for that batch as well as who, if anybody, should be notified in the event of an issue. For instance, Figure 6 shows where I'm configuring a template for Production SQL Servers. All of the alerts are enabled and in the event that one of them is raised, an email will be sent to me. SQL Response uses a standard SMTP interface, like SQL Mail in SQL Server 2005/2008.

Figure 6
If you need more than one alerting template, that's not a problem. Figure 7 shows a template for non-production SQL Servers where I've disabled the alert for "SQL Agent not running." This tells SQL Response not to monitor for that alert for any servers assigned to this template. If you’ll recall, on the dashboard you can uncheck the alert, but this simply hides it in the GUI. If you don’t want a particular alert monitored at all, the template is where you configure that.
Note that the email address is still the same as for the Production template, even though it is grayed out. One of the nice things is that I didn't have to create the new template from scratch. Since I had already assigned my email address to all alerts for the production template (and there is a wizard to do this so you don't have to hand-edit each alert), I used the feature to simply copy the Production template and then modify the alerts I don't want to fire on for my non-production servers (like SQL Agent).
The email alerts include a link to be able to view the exact alert. This requires SQL Response to be installed on the same computer where you click the link. However, if you're checking your alerts in your favorite mail client and the alert comes across the screen, you don't have to worry about navigating to find it. You simply click the link, SQL Response connects to the repository (if it wasn't already), and pulls the alert up for you.

Figure 7
In the event that you have "one off" servers which may deviate slightly from the template, that's not a problem. You can edit the server's alerts manually and those do not affect the template to which the server is assigned. If you want to reapply the default settings from the template, that's possible, too. There's an enormous amount of flexibility in configuring alerts.
SQL Response Recommendations for Databases
SQL Response does include the capability to look at databases and offer a few suggestions. For instance, it can check to see when databases haven't been backed up recently, when the page verify option is turned off (SQL Server 2005 and up), when databases have excess space in their files, and when indexes need to be defragmented or rebuilt. Figure 8 shows an example from a basic Windows Server Update Services (WSUS) database. A WSUS database, especially during patching, has a lot of changes and updates. This can lead to a good deal of fragmentation in the indexes. Sure enough, it's seen and reported on by SQL Response.

Figure 8
Low-Impact on Performance
Running SQL Response, I've not seen any significant impact on my monitored SQL Servers. This includes an old Pentium III 1.4 GHz system with but 1 GB of RAM. I figured if anything would show a hit in today's world of multi-core processors, it would. I was pleasantly surprised that as SQL Response monitored it, the CPU utilization only increased by 2-5% when SQL Response began monitoring servers. On the newer, more powerful systems, I didn't notice any impact.
The SQL Response monitoring agent, however, can take up some CPU and definitely requires server class hardware. I'm monitoring 8 servers and on a 3.4 GHz dual processor dual-core system, it monopolizes one of the cores by itself when it is querying the SQL Servers. However, the system is by no means unresponsive, even permitting the client to run without any noticeable pauses or hiccups (and there is an active SQL Server on the box as well).
Things I Wish Were Done Differently
If it sounds like overall I have had a positive impression of SQL Response, that is most certainly the case. However, there are always things that can be improved upon in the next version. There are two things that stand out to me that I'll cite, one a bit more important than the other.
The first concerns adding SQL Servers. SQL Response goes out and does the normal discovery, just like when you hit the drop down in Microsoft SQL Server Management Studio or the older Microsoft Query Analyzer. However, unlike those products, it does it automatically. I really wish it didn't. If you have a large number of SQL Servers out there, it can be difficult to find the ones you want to add to monitoring. For instance, in a development shop where every developer is potentially running SQL Server on his or her workstation (and multiple instances at that), that list becomes unbearably long. I would much rather have a button to "discover" which takes me to a new dialog window, separate from the master list of servers I'm monitoring or setting up to monitor.
The second is security related. The SQL Response repository allows any authenticated user to connect to it. This provides an issue in that a user who doesn't normally have access to a SQL Server can discover the databases on said SQL Server if it's being monitored by SQL Response. They can connect to the SQL Response Repository using a SQL Response client and flowing through the screens they can discover any issues that are being reported as well as the names of the databases. In addition, they have the ability to clear alerts, which might prevent someone who has it up on the console from noticing an issue (case in point, operations center staff who may not get the alert via email because they are seeing it on a big screen). Talking with the project manager, this is in the idea bin to address for the next version, so hopefully we'll see a security group or two which will be used to manage access to the repository. In the meantime, you can change the port it listens on and you can use other mechanisms, such as an IPSEC policy to restrict access to the repository.
Final Thoughts
SQL Response does meet the bill for a low-impact, intuitive monitoring application for SQL Server. With a starting price of US$495 per server, it's not very expensive, either. The dashboard is great and provides a lot of information to the DBA very easily. Alerting is simple but does the job. Performance was essentially negligible against the monitored servers and even the monitoring server wasn't taxed too greatly by the monitoring agent. There are a couple of improvements I hope will make their way into the next version, but they certainly aren't showstoppers. This leads me to an overall rating of 8 out of 10.


