The ‘Azure SQL Database DTU Calculator’ service recommends a 'Performance Level’ for a given SQL Server workload. A representative workload is run on an existing server and performance counters are captured. These counters are then supplied to the DTU Calculator, which makes a recommendation. The table below lists the current SQL Azure Performance Levels, the DTU Calculator will recommend one of these levels, based on your input.
| Standard Performance Levels | DTU’s | Premium Performance Levels | DTU’s | |
| S0 | 10 | P1 | 125 | |
| S1 | 20 | P2 | 250 | |
| S2 | 50 | P4 | 500 | |
| S3 | 100 | P6 | 1000 | |
| P11 | 1750 |
A ‘DTU’ is a ‘Database Throughput Unit’, it’s a calculation of the CPU & IO resource requirements for a given workload on a given server. The exact criteria used by the DTU Calculator to formulate a suggested Performance Level isn’t explained, but it’s calculated using the Performance Counters below:
- Processor – % Processor Time
- Logical Disk – Disk Reads/sec
- Logical Disk – Disk Writes/sec
- Database – Log Bytes Flushed/sec
I have two personal use SQL Instances at home that are candidates for migration to Azure: one hosted on a physical server and one on a virtual server. I used the ‘SQL Heart Beat’ framework described later in this article to benchmark these against different recommended SQL Azure database Performance Levels:
- Step 1 – SQL Heart Beats were run against both on premise servers once every 2 minutes, after 20 minutes an additional stress test was run.
- Step 2 – Performance counters collected on the physical and virtual servers were passed as .CSV files to the DTU Calculator.
- Step 3 – SQL Azure databases were created at different Performance Levels.
- Step 4 – SQL Heart Beats were run again against the SQL Azure databases once every 2 minutes, after 20 minutes an additional stress test was run.
- Step 5 – SQL Heart Beat runtimes were compared, the Virtual Server and Physical Servers against SQL Azure Performance Level S3.
This benchmarking process is illustrated in Figure 1 below.

The next step was to use the DTU calculator to determine what size Azure SQL Database I would need for each of these instances.
Physical Server
Figure 2 below shows % Processor Time on the physical server. The activity is entirely the result of SQL Heart Beats running at 2 minute intervals, and a stress test after 20 minutes. There was no other concurrent activity on the server.
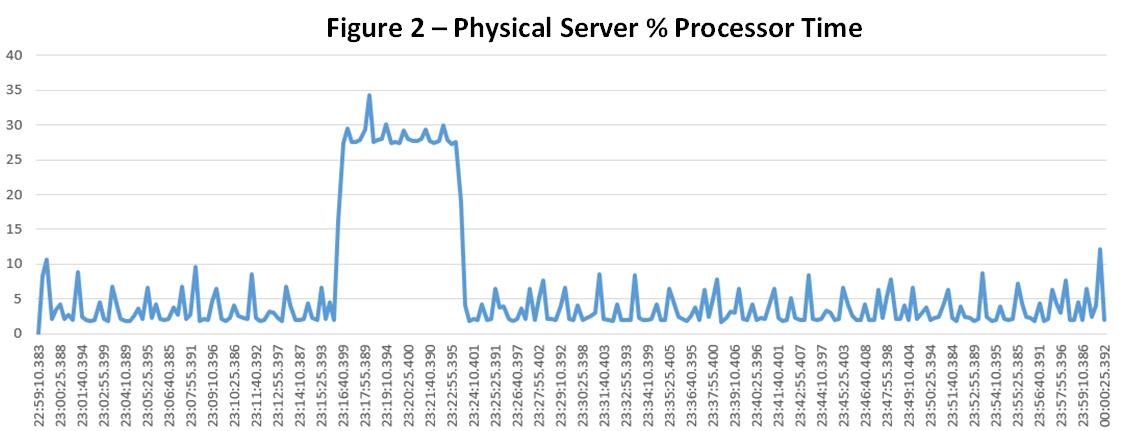
Figure 3 below shows Disk Writes/sec on the physical server, read activity was low.
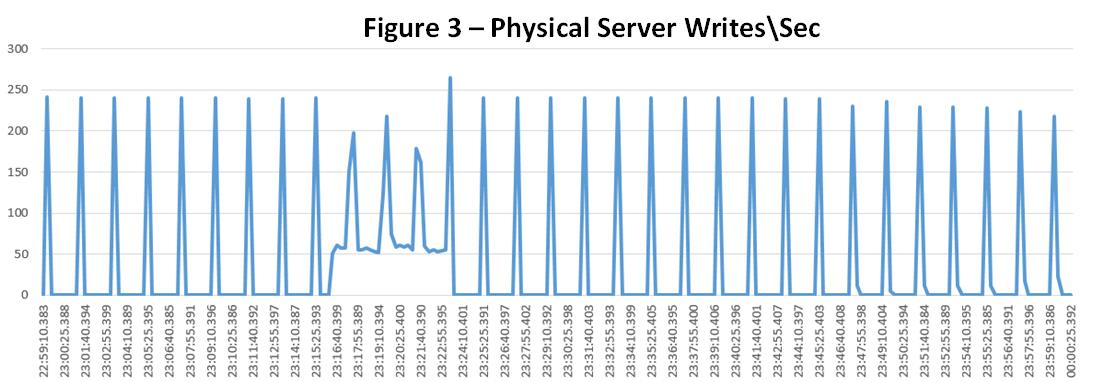
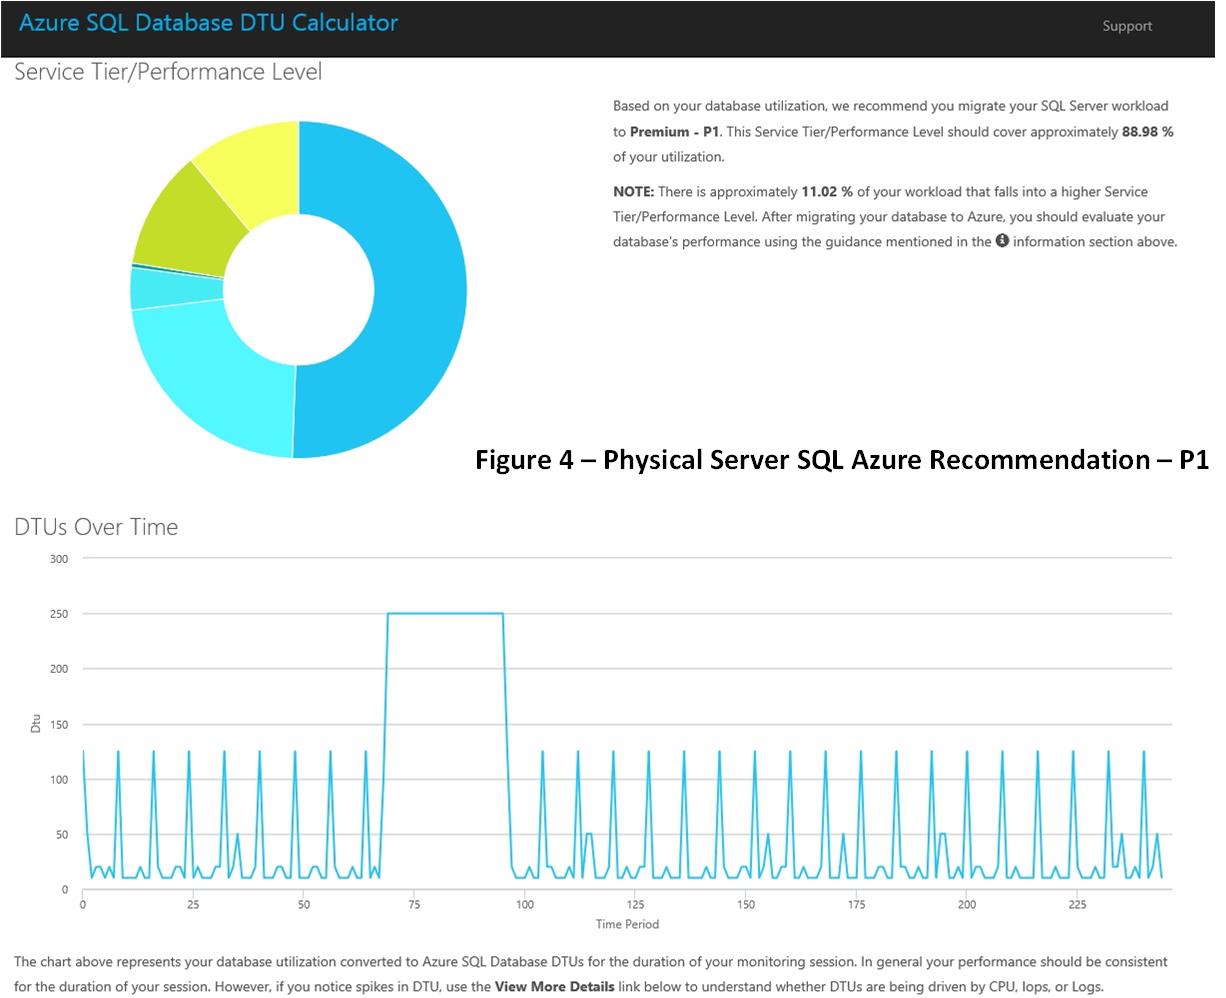
Figure 4 below shows the DTU Calculators suggested SQL Azure Performance Level – P1. The stress test requires over 250 DTU’s, even a SQL Heart Beat requires over 100 DTU’s.
Virtual Server
Figure 5 below shows % Processor Time on the virtual server. The activity is entirely the result of SQL Heart Beats running at 2 minute intervals, and a stress test after 20 minutes. There was no other concurrent activity on the server.
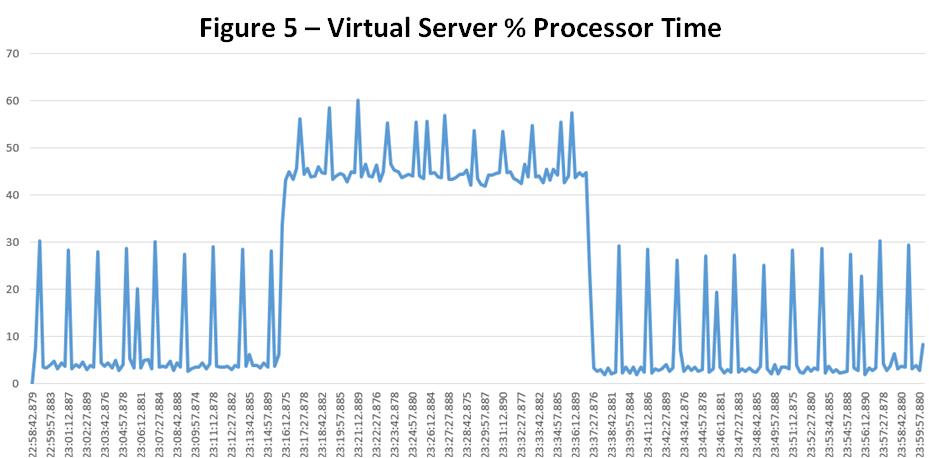
Figure 6 below shows Disk Writes/sec on the virtual server, read activity was low. The stress test workload took longer to complete than on the physical server.

Figure 7 below shows the DTU Calculators suggested SQL Azure Performance Level – S3. The stress test requires over 250 DTU’s, even a SQL Heart Beat requires over 100 DTU’s.

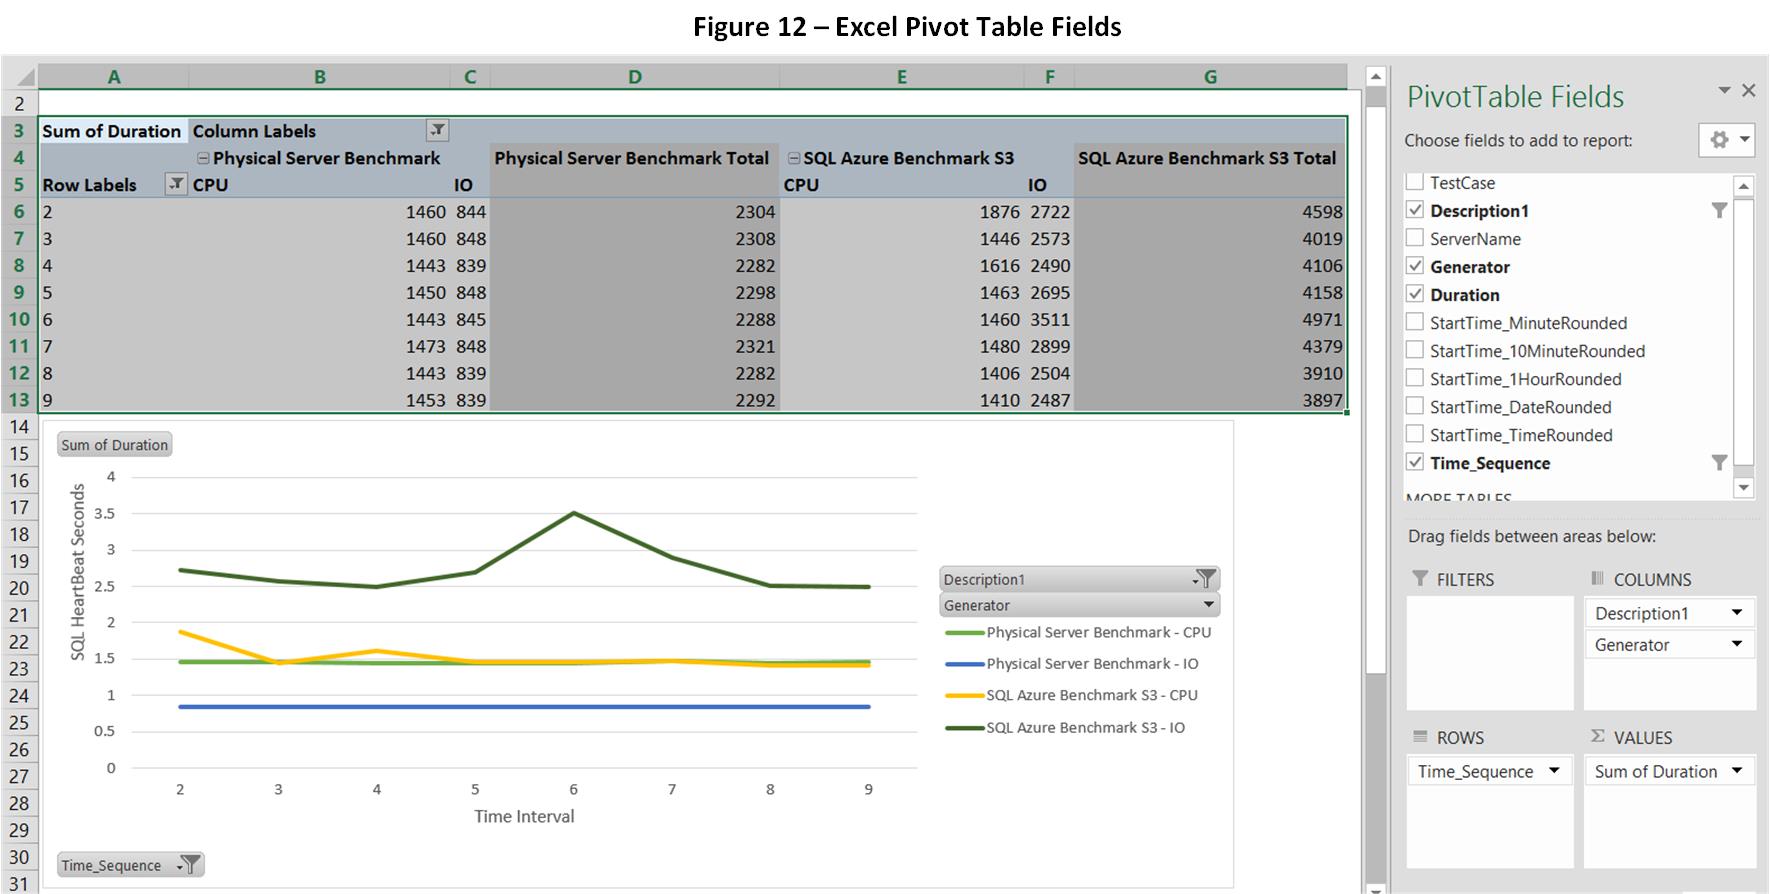
Next we create the database 'SQL_HeartBeat' in SQL Azure, change 'Performance Level' in the dashboard 'Scale' tab. Then we run the SQL Heart Beat setup script in SQL Azure, call the SQL Heart Beat stored procedure to recreate the workload. 'SQL Heart Beat Seconds' indicate runtime and latency, the lower the value is the better.
Virtual Server - SQL Azure Performance Level S3
Figure 13 below shows SQL Azure outperforming the virtual server from a CPU perspective at Performance Level S3. The IO performance of the virtual server and Azure were similar.

Physical Server - SQL Azure Performance Level P1
The DTU Calculator recommended SQL Azure Performance Level P1 for the physical server, but upgrading to Premium Level was not in the plan.
Figure 11 below shows a comparison of SQL Heart Beat runtimes on the physical server against SQL Azure Performance Level S3 again, a level below the recommendation. CPU performance on the physical server and SQL Azure S3 were similar, IO performance was better on the physical server.

Conclusions
The DTU calculator recommended SQL Azure Performance Levels for:
- A fixed workload
- Two servers, a slow virtual server and a faster physical server.
Exactly the same workload produced 2 different SQL Azure Performance Level recommendations, both seem reasonable.
CPU performance in SQL Azure was much better than the on premise servers at the Performance Level where IO matched. Note that the on premise servers are 5 years old.
References
- SQL Azure DTU Calculator – http://dtucalculator.azurewebsites.net/
- SQL Azure Performance – https://cbailiss.wordpress.com/2015/01/31/azure-sql-database-v12-ga-performance-inc-cpu-benchmaring/
SQL Heart Beat
A ‘SQL Heart Beat’ is the total duration (milliseconds) of a call to a stored procedure that repeats precise mathematic calculations using the same fixed starting point / initial dataset. The runtime performance of a call is very consistent in stable environments but also sensitivity to other workloads in contended environments.
To use the framework, first create a database called ‘SQL_HeartBeat’ then run the setup script attached.
The T-SQL script below was run once every 2 minutes for an hour with different descriptions for different servers. It runs a set workload that typically takes between 3 and 10 seconds depending on the server and concurrent activity.
USE SQL_HeartBeat
GO
EXECUTE dbo.SP_HeartBeat
   @Batches_IO = 20
  ,@Batches_CPU = 1
  ,@NewPatterns = 1
  ,@TestCase = 'SQL Server Central - Edit 1.3'
  ,@Description1 = 'SQL Azure Benchmark S3'
  ,@StressLevel = 3;
GO
USE SQL_HeartBeat
GO
EXECUTE [dbo].[sp_HeartBeat]
   @Batches_IO = 20
  ,@Batches_CPU = 1
  ,@NewPatterns = 50
  ,@TestCase = 'SQL Server Central - Edit 1.4'
  ,@Description1 = 'SQL Azure Stress Test S0'
  ,@StressLevel = 3
GO
USE SQL_HeartBeat
GO
;WITH CTE1 AS
(
    SELECT
         TestCase
        ,Description1
        ,CONVERT(VARCHAR(16),StartTime,120) AS StartTime
        ,Generator
        ,SUM(DATEDIFF(millisecond,StartTime, EndTime)) AS Duration
    FROM dbo.TimingResults
    GROUP BY
         TestCase
        ,Description1
        ,Generator
        ,CONVERT(VARCHAR(16),StartTime,120)
),
CTE2 AS
(
    SELECT
        TestCase, Description1, @@ServerName AS ServerName, Generator, Duration, StartTime,
        StartTime AS StartTime_MinuteRounded,
        CONVERT(VARCHAR(15),StartTime,120) + '0' AS StartTime_10MinuteRounded,
        CONVERT(VARCHAR(14),StartTime,120) + '00' AS StartTime_1HourRounded,
        CAST(StartTime AS DATE) AS StartTime_DateRounded,
        ROW_NUMBER() OVER(PARTITION BY TestCase, Description1, Generator ORDER BY TestCase, Description1, Generator, StartTime) AS Time_Sequence
    FROM CTE1
)
SELECT *
FROM CTE2
ORDER BY TestCase, Description1, StartTime