

Business Intelligence has been growing tremendously in the past 20 years, and its market is heating up in the past five years. The step toward ever more personalized and custom (or ad-hoc) data reporting, data presentation, and data analysis have added the excitement. Personalization is on one hand the result of the data growth (more data means more need for detailed data insights) and on the other hand the need and ability adapting to changes in business processes and on the market as well.
Microsoft R Services in SQL Server 2016 is the answer to this personalization of business needs, and it is a very good answer. What Microsoft promised in early 2015 and what has been cooking on blogs and forums, Microsoft delivered. Microsoft R Services is the product that enables users to calculate simple, advanced and predictive analytics against data stored in SQL Server database. Practically this means it is an operational engine, capable of fulfilling and delivering any kind of data analysis needed with no extra tools or any additional installation.
Looking back over the course or four years, since my first implementation of the R framework within SQL Server for a specific retail project and coming back to present time, I am utterly happy that R had become part of SQL Server in both Standard and Enterprise editions. Both editions are what corporate (enterprise) environments need. And I hope that in the future more projects will be based on R integration with SQL Server. In addition, making a recap on feedback that I have gathered on forums, blogs, SQL Saturday presentations and discussions, people were – back then and nowadays - very much keen on implementation of R engine in their corporate environment, mostly for the purposes of statistical analysis and making predictions.
In this article, I will point out the biggest concerns when it comes to the R implementation with answers, followed by how-to steps for introducing and implementing R Services within enterprise environment.
Concerns
A few concerns that you or your organization might have, along with some reasons why you should not be worried.
R is open source software. My management disapprove anything that is open source.
R language is a free software (under GNU license) and many businesses embrace this kind of software along with it benefits. However, free software has, and still does divide people into two groups: free/open-source evangelists and business sceptics. With respect to both sides, and I must say I am on open-source evangelist side, this analogy is also presented with R language.
The first distinction worth explaining to sceptics is the difference between R engine and R libraries (or packages). The engine is written by core group of roughly 25 people with access to the R source code. In addition, many more people contributed and donated code, bug fixings and more, including the documentation. The R libraries (packages) are mostly community driven, meaning people in community are free to develop and create variety of different libraries. In addition, I must say, community contributions should not be overlooked. These libraries follow CRAN standards and are highly responsive to novelties and one can find many very useful libraries. Furthermore, with a variety of statistical tools available on the market nowadays, the statistician, data scientist or researcher in a corporate environment will most likely have additional tools for back testing and double-checking the results generated. And it is highly likely the R language will be one of those additional tools (if not the primary tool).
With R Services, Microsoft is guaranteeing the support for their multithreaded and parallel RevoScaleR library (package) and fully compatibility with SQL Server tools and cloud services. And hopefully we will see in the future new libraries being developed from Microsoft side.
Users can take a long time to learn the R language and there are no menus or drag and drop possibilities when using R.
Both concerns are true. The R language, by default, does not provide any drag-and-drop GUI options. The purpose of Microsoft R Services is the ability to enhance your data insights against your OLTP or OLAP data sources, and for this purpose, the R and T-SQL integration in SSMS is perfect, easy to use and fast to adopt. Also data exploration can be done in the same way or by any other tools from the Microsoft stack: SSRS, SSAS, SSIS, Excel.
Microsoft also provides a outstanding free feature R Tools for Visual Studio for Visual Studio. Tool will give all the users, in particular data scientists, an integrated development eco-system for R with nice debug and visualization features, interactive windows, and beautiful GUI experience. Several other tools are also available: RStudio, Emacs, Shiny, RPubs, ...
Users can take some time to learn R language, but if you have a statistical and programming background, taking up R should not be a problem. Libraries available on the official CRAN repository are nicely documented with examples. On the other hand, users with little or no statistical background, just be sure to have your code and results reviewed by your data scientist peers. Also investing some time into basics on statistics would also be good. Many white papers, on-line videos and books are available free of charge.
R is free software and less secure and therefore more vulnerable to unauthorized users accessing sensitive business data.
Microsoft completed quite a bit of work on security issues, and all R code that is passed as a parameter to a T-SQL extended procedure is executed securely. Setting correct roles and schemas on your SQL Server should also add to security. The Service SQL Server Launchpad was created for running CLR external stored procedure, which parses R and handles garbage collection, type safety and memory management very well.
There is also the »soft« side to it. With R services, everyone can now run R scripts directly from SQL Server and this make less need for data imports/exports, especially when users want to run statistical analysis. DBA, data analyst, developers, data stewards, and process owners can now work closely with data scientists. They receive prepared code from data scientists and just run it for the particular purposes needed. With less data movements, out and back into the database, a more secure system exists with less one point-of-failure.
But security should never be taken for granted. Anyone, with access to sensitive business data, can expose unwanted information. So please, do not ignore this aspect, since it is independent from R Services or any SQL server service available.
Can we use R for data segmentation and marketing campaigns or only for prediction analysis.
R Services were introduced in SQL Server 2016, and presented as a highly scalable and parallel data prediction engine, that is available as part of your SQL Server 2016 installation. Furthermore, R Services can be integrated into Power BI, Azure, Excel, and other applications. Users can create beautiful visualizations, using many powerful R libraries, and embed these graphics into Power BI, SSRS, Mobile SSRS, Sharepoint, Excel. R script in T-SQL is also very useful also for many advanced statistical approaches, such as customer segmentation, analysis of your marketing campaigns, stock optimization problems, warehouse problems, travelling salesman problems, churn analysis, fraud detection, insurance problems, recommendation problems, loan banking problems, prices problems, and many industry related approaches.
All these and many more can be supported and handled by R. Coming back to initial idea of data predictions, this is gaining popularity across industries with the rise of machine and deep learning, IoT technologies, image detections, face and writing recognitions, R integration is suitable for any of these tasks. With full installation of SQL Server 2016, your business is now supported by a strong data analysis tool, capable of cracking any data insight related job.
R in an Enterprise environment
With some of most frequent concerns covered, the one left – that is the main topic of this article – is where and how to start an R installation, setting up the environment and start using it in production. I will outline what had worked couple of times for my installations on different projects or with different clients. It is a guideline how to tackle common issues, but it is by no means a must-follow rule.
Prerequisites
SQL Server 2016 comes with basic R integration available in all editions except Express and Express with Tools. Advanced R integration and R Server (Standalone) are available only in Enterprise and Developer edition. If you are getting to know with R language and thinking of setting up the analytical environment, any editions will be suitable at this point for your enterprise environment. Advanced and R Server editions are capable of high performance data analysis and scalability, features which are not supported in Basic R integration. But later upgrades to Advanced or R Server edition should not be a problem at all.
I would also advise to have a data scientist present when working on setting up environment and data integration. Their insights will help architects, business users, DBA and system administrators help set up roles, users tasks, databases, data marts, data visualization and process flow.
Database and data marts
When setting up the environment to support R Services, take into consideration where your data resides. For the purposes of statistical analysis as well as predictive analysis, you will need to expose your data to R Services. If you will be doing analysis on transactional data or if you will be running analysis on aggregated data, you should consider having a separate database with data marts for purposes of statistical or predictive analysis. The output of these analyses – models and predictions – are stored in a separate database. Without disturbing the enterprise data environment, I strongly support two additional databases – one to have data feeds for analysis and the other one for storing statistical and prediction models with prediction scores.
I would suggest adding two additional databases for R services. Even if you have 3-tier, 4-tier or 5-tier configurations (development, testing, quality assurance, staging and production), adding two additional databases will make statistical analysis and the deployment of models and predictions much easier. Data scientists might also request a sandbox environment, and for playing, testing, “feeling” and “getting to know the data”. Do not be afraid of adding this – this type of environment has proven to be very useful and much appreciated.
Essentially, two databases are recommended; Models and Data. In the Data database, all the data will be stored, from fact data, data marts to any kind of data needed for data analysis. In Model database layer, all the models with evaluations and scores will be stored and fed to the models in production.
Several reasons support this structure. Models are calculated predictions of a desired state for the targeted outcomes that – when brought to production – give highly important information on future state of the outcome (e.g. customer being buyer, product going out of the stock). Therefore, database holding prediction values might be important. These values can be exposed to a web service (Azure ML or third party tool) for business predictions. It is up to your policy, whether to replicate these values or let them be daily recalculated and changed. If company decides to create backup as such, I would also recommend enabling auditing for future analysis on any kind of model changes. In addition, the speed of storage might play a part – especially when dealing with larger data sets. All these special needs for backup, exposing to web or additional auditing would make it easier when prediction values are on separate database unit. I have had much better experience when data for calculating statistics and models with predictions were stored separately.
Furthermore, if you are saving or importing to external files – especially files for RevoScale R library – think of speed as well. With bigger datasets come also higher requests for hardware performance and storage settings, (this might be different from productions – resource governance, snapshot isolation, etc.). Overall, separate databases will make handling statistical analysis and predictions much easier. This way will also have minimum change requested on production database.
Users
Defining users who will have access to data, models, evaluations and predictions is closely related to their line of work. With their work in mind, you also have to give these users access to a set of tools to be able to do their work. When setting up the user roles for running R scripts, both data and model layer needs to be taken into consideration. On data layer, at least two roles will be needed. People from the business need a role for running reports for confirming the models and later to run reports on model performance outcome. Data analysts and data stewards need a role for for cleaning the data and for running any kind of queries or statistical analysis for preparing the data (data will be prepared for data scientists).
Access to the model database for scoring and model evaluations is by default granted to data scientists. A separate schema on this database must be created for business people. Their role will be model approval. This has turned out to be the easiest way for data scientist to run the tests on different models and business to decide which model will be confirmed and later put into production. Models have had - in my installation - always the target variable, independent variables and descriptions along with purpose of the model (e.g. stock management for set of products, fraudulent behaviour of customers in particular store, etc.).
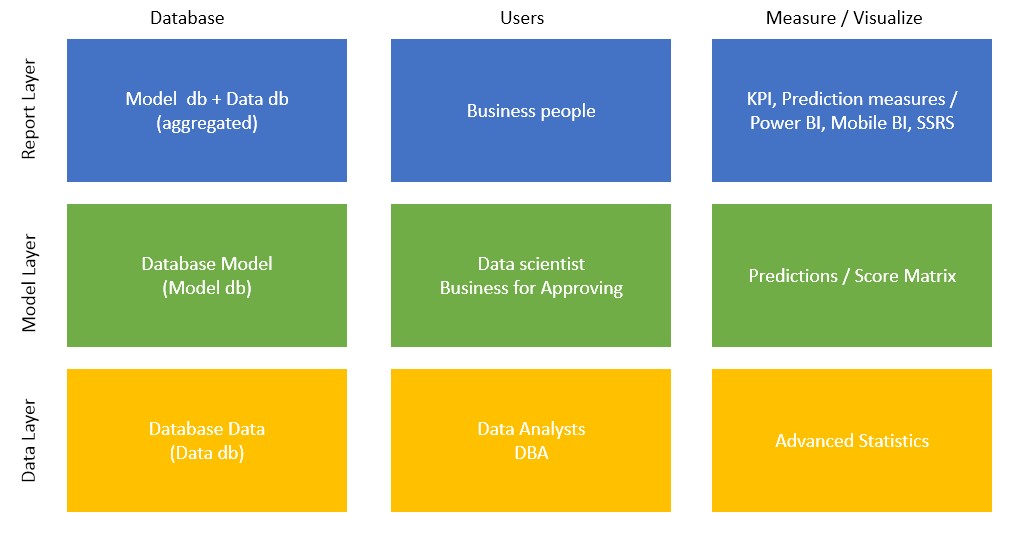
Some overlap can be expected. Especially when you address the question of which department can access which set of information. There should also be data and model layer overlap between data scientists and businesspeople. And some overlap between model and report layer for business people (for better understanding, see the diagram below). Once you have vertical overlaps and roles set, your tasks should be much easier.
Measure & Visualize
Measuring the success is very important when evaluating the statistics and scores prepared in data and model database. Make sure to have measures of sucess before going into production. The success rate of a model is arbitrarily set for your line of business and must be set (e.g.: lift in sales for 1% or faster stock rotation for half a day) in cooperation with the business.
The report layer is prepared for data visualization and data presentation. Use pre-prepared custom reports built specificly for your business case. This should be relatively straightforward as to what users should see in report layer: aggregated data with predictions in form of SSRS or Power BI, Excel, etc. The data scientist, data analyst, or data steward in this case will use other tools/means for evaluating the score for models or the visualization of transactional or aggregated data.
The following diagram shows a simple visualization of delegation of users, roles, databases and data. This is simple depiction and based on your business model or need, when thinking of starting to use R in your enterprise environment.
Security
Security improved significantly since release of the SQL Server 2016 CTP3. In the RTM version, server roles used for running extended procedures are automatically added, but you should still check that you have db_datareader privileges in the database. The system administrator needs to set the parameter, External script enabled, in sp_configure configuration. For this server role users and logins can be added, based on the company policy. In addition, database permission “EXECUTE ANY EXTERNAL SCRIPT” must be granted.
Please also note, when installing additional R libraries that a user might need for running a specific R script, additional rights should also be set. Currently, Microsoft proposes the installation of new libraries to be done using R command prompt or using R Tools for Visual Studio. Another way is using XP_CMDSHELL.
Business Goals
Through the whole article, I have been focusing more or less on the aspect of IT, technology questions and data science issues. However, the most important thing will be a creating a clear goal that will satisfy a business need. Do not go to deep into the nature of statistical analysis and mathematics behind prediction algorithms, but rather come halfway toward the business to support their idea. Important points are good cooperation and positive communication.
Unveil the changes
Once you have your databases with all the procedures and data marts prepared, and you have your prediction models doing scores on your target data, be aware that prior to deploying all the code and data to production, these changes might have some drawbacks. Firstly, any extra change needed to support prediction models might have create costs and additional customization on your production system. Secondly, please consider having couple of data scientists on board, so that they will closely monitor and measure the results of deployed prediction model. Such monitoring and frequent updates will also take some of the resources (time, effort, costs). Thirdly, be prepared that not all the models work!
This said, make sure you explain to end users and your managers that either it takes some additional time for models to be trained or you need to do it all over again. Hopefully, models not working should be tracked before going to production. But also such cases can be happening. Lastly, people might be afraid of changes, especially those who will not understand the statistics or the background. Try to be – now for the soft skills – polite, nice and mostly patient with such novelty.
If you are replacing and previous line of work with new prediction models, be prepared to get some revolts. Have everyone explained that you will be doing this in steps and whenever it turns out that this will not work at all, you can switch it back in an instant.
Author: Tomaž Kaštrun (tomaz.kastrun@gmail.com)
Twitter: @tomaz_tsql
