Overview
This past year my wife and I have been creating (compiling, writing, rewriting, etc) a set of tools that allows us to efficiently monitor our SQL Server 2005 and beyond databases without spending money on a monitoring tool. I work at a company that has a very tight budget and I wanted a way for the database to tell me if something was wrong, or about to go wrong. I also wanted something that was created using SQL and easy to deploy to a new instance of SQL Server.
We decided we wanted to start monitoring things like;
- File growth (TempDB and LDF)
- Performance statistics (CPU, connections and memory)
- Database blocking
- Long running queries
- Long running SQL jobs
We used SQL Jobs and stored procedures to capture data and send emails or text alerts based on metrics that we defined. We created a couple of tables to store the configuration of these alerts. For example, I need to know when there is blocking that lasts longer than 20 seconds. My wife didn’t need to know about any blocking until well after that. You can also configure which databases you want to be excluded from being monitored or just excluded from specific alerting.
In addition to the monitoring and alerts, we wanted to create a comprehensive daily report for checking the overall health of a database server. It had to provide a good summary view of the server and what happened in the last 24 hours. We found a daily health report created via a stored procedure, that guest columnist Ritesh Medhe had published on SQLServerCentral.com. It dynamically generates an HTML blob and delivers the results via email. http://www.sqlservercentral.com/articles/Automating+SQL+Server+Health+Checks/68910/. It was a great idea and we decided to expand on it by adding more details to existing sections in his Health Check and adding sections of our own.
We’ve collected everything in a self-contained script that we could run on a new server. It creates a database and all the stored procedures, tables, SQL Jobs, etc. to install our monitoring solution. I was getting tired of calling it “our monitoring solution” and we decided to name it. DBWarden was born!
DBWarden relies on SQL Agent, DBMail and the use of Operators.
There is a data dictionary to help explain the usage of the tables. We included a set of objects used to create the data dictionary. These data dictionary objects were created by a columnist on SQLServerCentral.com, David Poole in Oiling the gears for the data dictionary. It’s a very easy way to get all the extended properties in place.
Installation and Setup
DBWarden can be installed by simply running the SQL script on your database server. There is a header in the file that contains the objects included in the script and brief install instructions. The script can be found on our Sourceforge page http://sourceforge.net/projects/dbwarden/.
Before running the script, you will need to find/replace the phrase CHANGEME with relevant data. There are two areas you will find this. The first section is creating the DBMail Operators. There is an operator for email and one for text. These operators will be used later in the script to populate the configuration tables. The other section is the update to the DatabaseSettings table. You can list the databases that you don’t want to be part of the monitoring.
*This includes Schema change tracking. If you do NOT want schema change tracking on a database, make sure you add the database name and set SchemaTracking to 0. Otherwise, the database trigger and schemechangelog table WILL be created in that database.
You also have the ability to easily rename the database name where DBWarden will reside. Right after the first section that creates the operators is the create database statement. The default is [dba]. Use Find/Replace to change “[dba]” to “[newDatabaseName]”.
Now you are ready to run the script. It will create the database and all objects needed, including setting up the extended properties.
Configuration for Alerting
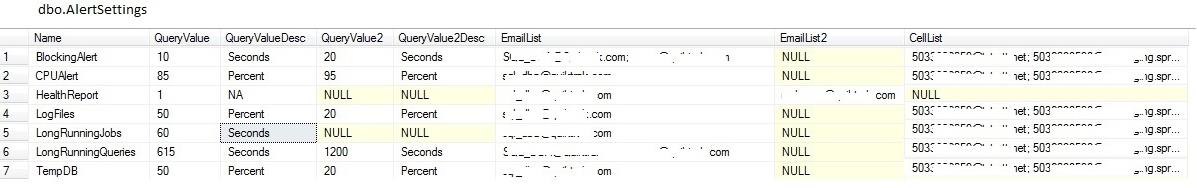
There are two configuration tables, AlertSettings and DatabaseSettings. Alert settings is used for individual alert settings such as blocking and controlling the thresholds for long running queries and jobs, log file growth, TempDB growth and CPU usage. There are two settings for each alert, one for email and one for text. The “QueryValue” column and “QueryValuedDesc” column are the configurations for the email alerts. The “EmailList” column is used for the primary recipients and “EmailList2” is used for the carbon copied recipients of the email alerts. The “QueryValue2” column and “QueryValuedDesc2” column are they configurations for the text alerts. The “CellList” column is used for the recipients of the text alerts.
There is also an entry for the Health report to determine who to email the results to, although the health report can’t be texted so those settings will not be used for this alert. Here is a screenshot of the table contents with default settings followed by a description of those settings. These settings can be modified in the DBWarden script for the insert to this table or via a table update after the inserts are made.
Each of the items are explained below.
- Blocking alert – email if blocking occurs for 10 seconds, start sending text alerts after 20 seconds of blocking
- CPU alert – When the CPU percentage of SQL Server rises above 85%, it will send an email. A text alert is sent at 95%. This alert is sent via the job dba_BlockingAlert.
- Health Report – The health report will be sent to the email in EmailList. The Health Report is sent via the job dba_HealthReport.
- Log file growth – When an LDF is more than 50% used, send an email. If the LDF grows and has 20% space left. This alert is sent via the job dba_CheckFiles.
- Long running jobs – 60 seconds – Only report long running jobs that run longer than 60 seconds (possibly indicating it’s about to grow), it sends a text alert. This alert is sent via the job dba_LongRunningJobs.
- Long running queries – Send an email when queries run longer than 612 seconds and text alerts after 1200 seconds. This alert is sent via the job dba_LongRunningQueries.
- TempDB growth – same as above, 50% for email notification, 20% for text alert. This alert is sent via the job dba_CheckFiles.
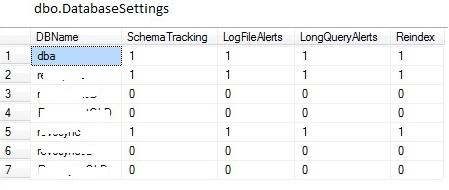
The DatabaseSettings table is for turning monitoring options on/off for a given database. 0 is Off and 1 is On. All user databases are monitored by default. When SchemaTracking is On a database trigger called dbo.tr_DDL_SchemaChangeLog and table called dbo.SchemaChangeLog are created on that database. Each time a schema modification is made the trigger puts a record into SchemaChangeLog.
This data is reported in the Health Report via the job dba_HealthReport, detailed below. SchemaTracking should not be on for replicated database and should be tested for other databases. We have found that some third party tools will stop being able to upgrade and perform certain operations due to the database trigger. LogFileAlerts is used by the job dba_CheckFiles detailed below. If this is On for a database, it’s ldf is monitored for growth. The LongQueryAlerts flag is used by the job dba_LongRunningQueries to know which databases to collect long running query information for.
There is also a flag in the DatabaseSettings table to stop Reindexing. This is a work in progress feature. We created a wrapper procedure for Ola Hallengren’s reindex/defrag script to look at this table to determine if a database should be skipped during reindex/defrag. We have not included the wrapper procedure in the DBWarden script as of yet.
SQL Jobs for Monitoring and Alerting
By default, all SQL Jobs will be disabled so you can modify the job schedules if you do not like the defaults. Enable them to start collecting data and send alerts. Here is a description of the jobs and the default schedules;
- dba_BlockingAlert – Runs every 5 seconds. This will run usp_CheckBlocking and will store data collected into the BlockingHistory table. There is a trigger on this table that will send the alert. The trigger is used because of a bug experienced previously with inaccurate reporting.
- dba_CheckFiles (LDF and TempDB) – Runs every 1 hour. This will run usp_CheckFiles to determine if TempDB or any LDF is growing. It utilizes the stored procedure usp_FileStats to collect data into the FileStatsHistory table.
- dba_CPUAlert – Runs every 5 minutes. This will run usp_CPUProcessAlert to determine if the CPU thresholds have been met. It utilizes the stored procedure usp_CPUStats to collect data into the CPUStatsHistory table.
- dba_HealthReport – Runs every day at 6am. The details of this health report are in a section below. You can have the report run less frequently than daily, but certain sections listed as “Last 24 hours” will only report on information from the last 24 hours. This will run rpt_HealthReport with the following parameters
§ @Recipients – Primary recipients
§ @CC – Carbon Copy recipients
§ @InsertFlag – To control whether the report is stored in the HealthReport table.
§ @IncludePerfStats – To include Performance statistics; Buffer Hit Cache and CPU graphs. You must have the dba_CPUAlert, dba_MemoryUsageStats, and dba_PerfStats jobs running to collect data in order to turn this on.
§ @EmailFlag – If you don’t want to email the report (for future use when we create a UI for retrieving past Health Reports)
- dba_LongRunningJobs – Runs every 1 hour, This will run usp_LongRunningJobs to determine if and SQL Jobs are currently running over their average runtime. It utilizes the stored procedure usp_JobStats to collect data into the JobStatsHistory table.
- dba_LongRunningQueries – Runs every 5 minutes. This will run usp_LongRunningQueries to determine if any queries on a database are running too long. It also stores data into the QueryHistory table.
- dba_MemoryUsageStats – Runs every 15 minutes. This will run usp_MemoryUsageStats which gathers information using dm_os_sys_info and inserts this data into the MemoryUsageHistory table.
- dba_PerfStats – runs every 5 minutes. This will run usp_PerfStats which gathers information using dm_os_performance_counters and collects data into the PerfStatsHistory table.
Health Report
Here are the components included in our health report. Ritesh Medhe’s Health Check included sections that we used for Job Status, Databases, Disks, and SQL Server Database Backup Stats.
System: This section contains the instance name, processor specifications, server operating system, total server memory, instance uptime, and is clustered

SQL Server: This section contains the SQL Server version, instance startup date, memory foot print, default collation, user mode, and SQL Agent status.

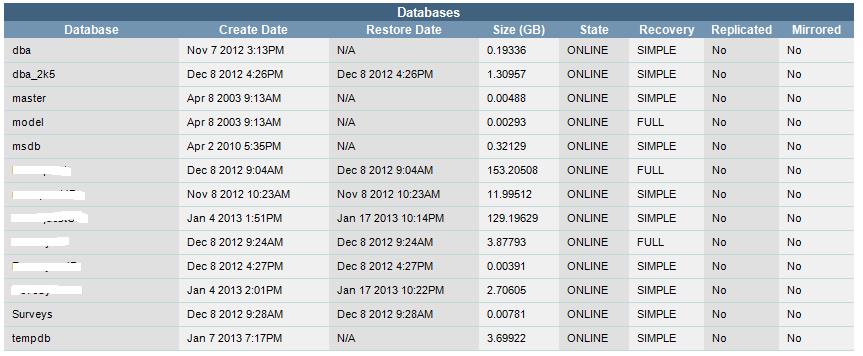
Databases: This section contains a list of databases with creation date, database size, state ( ie. online, offline), recovery model, is replicated and is mirrored. SQL Agent will be green if up and red if down.
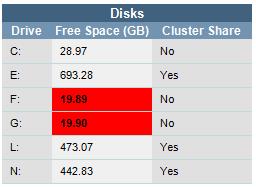
Disks: This section includes the disk drives available, free space on each drive, and whether or not each drive is a cluster share. The free space will show up as red if the drive space is less than 20 GB. We had trouble finding a reliable way to get the total drive space via SQL, otherwise this section would be included and the red would show up if a certain percentage of the disk drive was free.
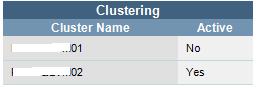
Clustering: This section includes cluster node name and which node is active.
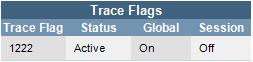
Trace flags: This section will include active global trace flags.
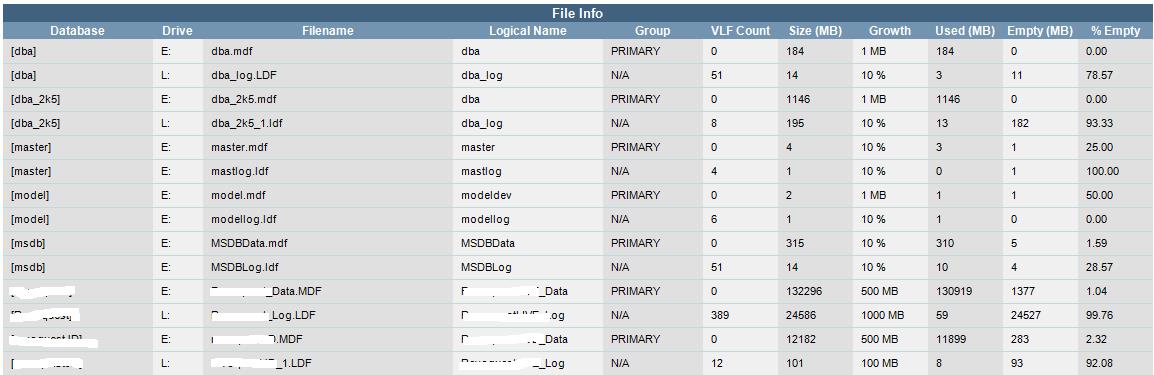
File Info: This section contains the database file names, what drive they are located on, the files logical name, what group they are located on, virtual log file counts, growth settings, space used, space empty and percentage empty. If an LDF is larger than an MDF, the LDF size will show up in yellow to highlight a potential problem or configuration issue (i.e. Database mode is set incorrectly)
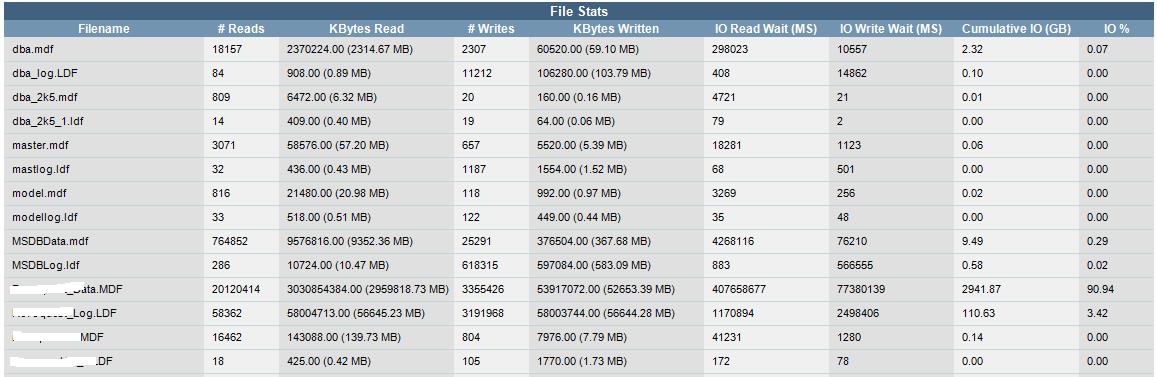
File Stats: This section includes each database file, with recent read and write statistics.
Mirroring: This section will show up if you have mirroring set up. It will tell you the database(s) being mirrored, the state, server role, partner instance, safety level, if automatic failover is on, and if it is a witness server.

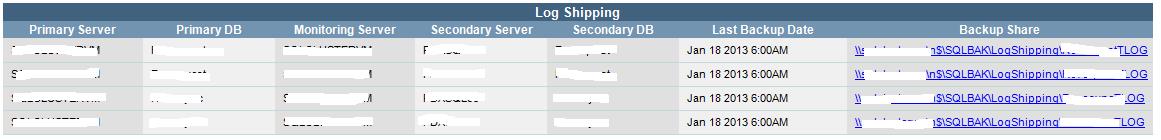
Log Shipping: This section will show up if log shipping is set up and configured as a Primary, Secondary or Monitoring server.
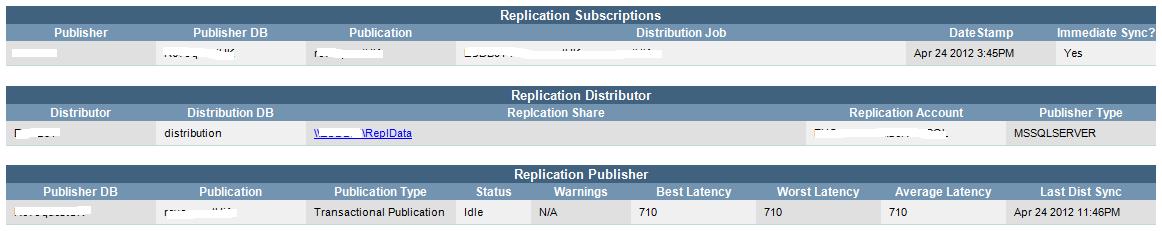
Replication: This section will show up if Replication is set up and configured as a Publisher, Subscriber or Distributor on the server.
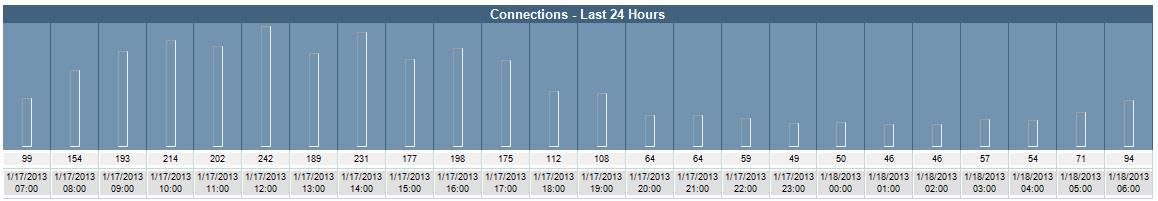
Connections: If the SQL job to collect Performance statistics is on and the Health Report parameter (@IncludePerfStats) is set to 1, then this section will show up displaying the connection count in hourly intervals.
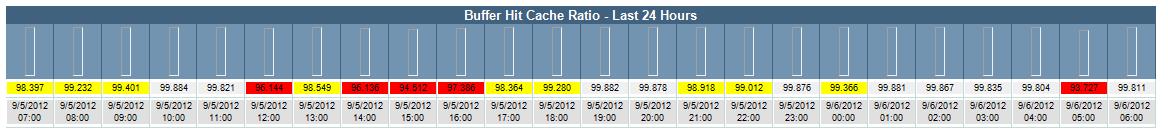
Buffer: If the SQL job to collect Performance statistics is on and the Health Report parameter (@IncludePerfStats) is set to 1, then this section will show up displaying the buffer cache percentage in hourly intervals.
CPU: If the SQL job to collect Performance statistics is on and the Health Report parameter (@IncludePerfStats) is set to 1, then this section will show up displaying the SQL Server CPU usage in hourly intervals.

SQL Agent Jobs: This section will display all SQL Jobs and their current state, last run outcome, average run times and last run execution time.

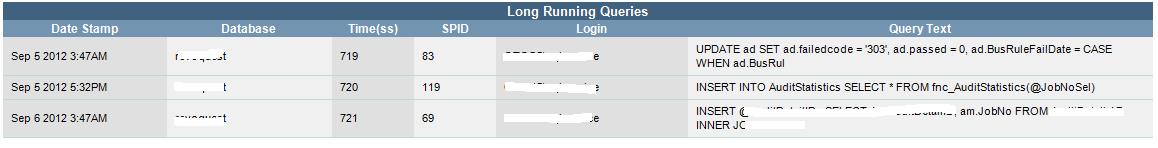
Long Running Queries: This section will show details if there have been any long running queries on the server. It will display session information and a limited amount of the query text that was run.
Blocking: This section will show details of any blocking that occurred on the server. It will display session information and a limited amount of the query text for blocking and blocked sessions.

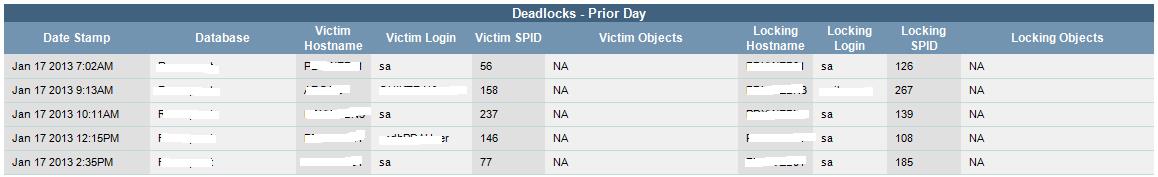
Deadlocks: If Traceflag 1222 is on globally and you have recorded deadlocks in the error log, they will be displayed here. This section is a work in progress and will show the locking and victim’s login and session information. The idea is to also display the database objects that were involved.
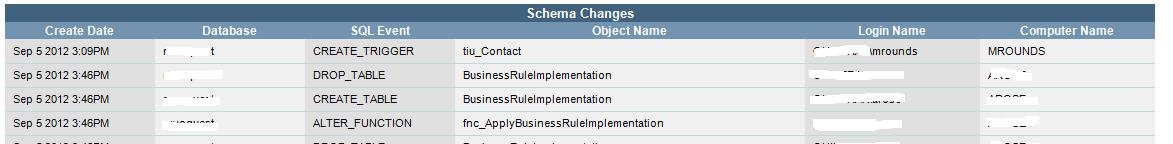
Schema Changes: This section will show any schema changes that have occurred on the databases that have been set up to have schema changes monitored via the trigger in dbo.DatabaseSettings.SchemaTracking. It includes create date for the date the change was made, the database affected, the type of event (ie. CREATE_TRIGGER, DROP_TABLE), the object affected, the login of the session that made the change, and the computer name of the session that made the change.
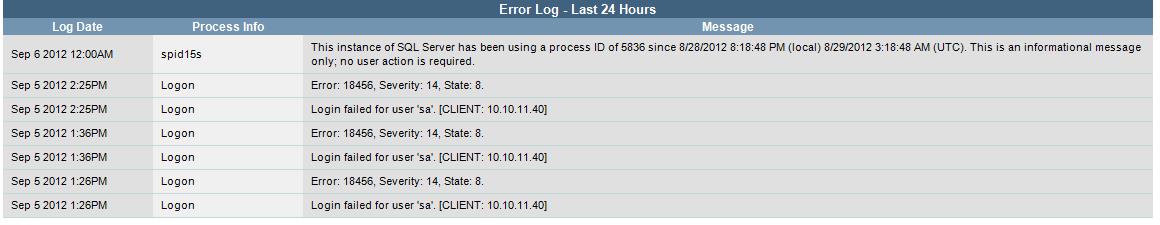
Error Log: This section shows the information that has been written to the error log in the last 24 hours. It excludes deadlock and backup details that have their own sections in this report.
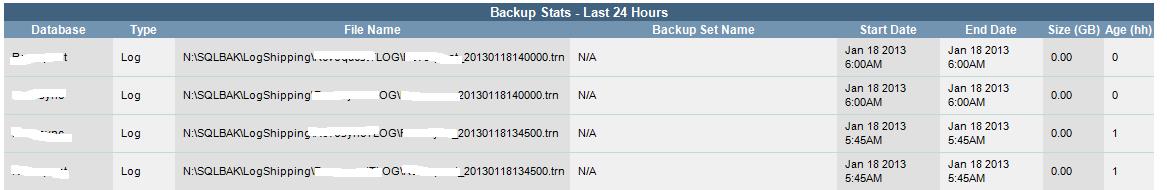
Backup: This section will show all of the backups that have been taken in the last 24 hours. It lists the database, the type of backup (ie. Full, Differential, Log), the File name and location, the backup set name if it is part of a set, the start date and the end date, the size in GB, and the age in hours.
Summary
Not everyone can afford database monitoring software. Tight budgets often dictate how effective a DBA can be at keeping their servers running smoothly. Our goal with DBWarden is to help you monitor efficiently, without killing your budget.
DBWarden is a work in progress, and we’re always adding new features to it and fixing any bugs found. We are very excited to provide what we’ve done to the community to use and to contribute to its evolvement.
If you'd like to give DBWarden a try, the code can be found on our Sourceforge page at: http://sourceforge.net/projects/dbwarden/.