


You should benchmark your storage immediately. If you are a database administrator, you should benchmark it yesterday. And today. And next week.
Well, that’s exaggerating things a bit… but storage performance should be at the core of your ongoing performance metric collection and test process. Storage performance matters that much to the business your data powers. If it’s not performing well, it’s your duty to document and then work with the folks responsible to do something about it.
Why does it matter so much?
Consider a modern application server stack.
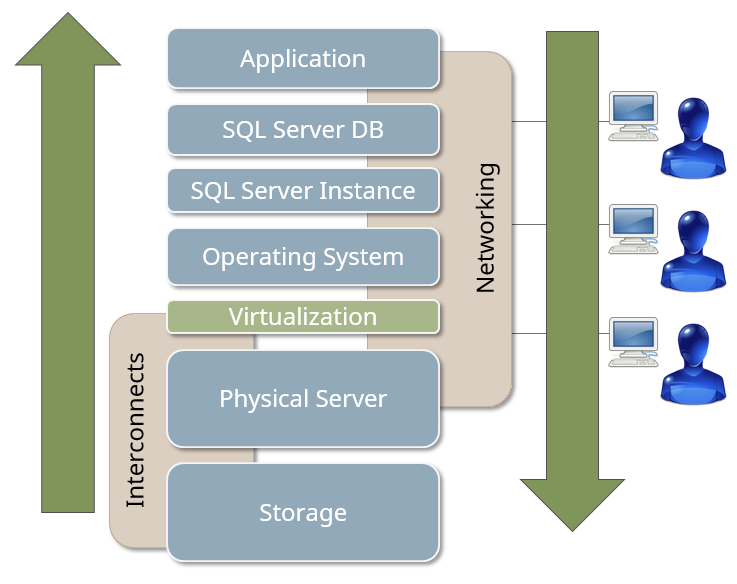
Profile the items in this stack for their performance characteristics. Generally speaking, storage performance is slower than memory or CPU. Application code can be all over the place so I’ll disregard that layer for this discussion.
 Your storage slows down your SQL Server. It’s the inherent nature of the technology. So, storage is slow? Why? It’s the most complex component in the stack, has the most moving parts, and historically has the slowest components. Modern flash arrays are working in our favor nowadays, but it’s still slower than memory or CPUs.
Why is it so complex? It’s not just a black box, as usually represented on a lot of system diagrams. Expand the storage component in this stack. It’s not that simple.
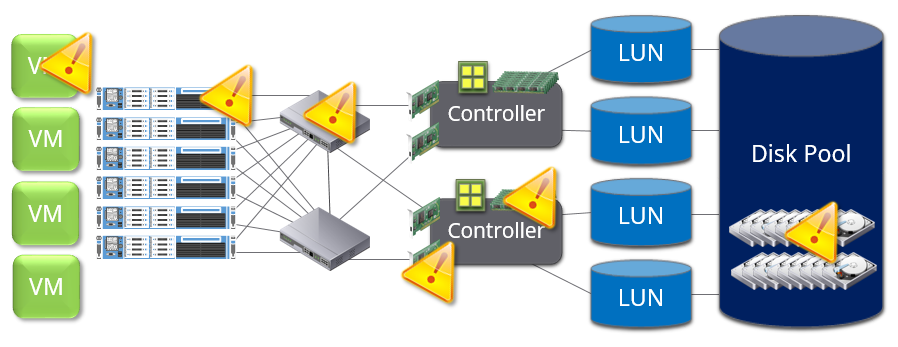 A modern storage platform has many layers and parts, all of which are endlessly customizable by the organization and the storage administrators who architect and maintain such environments. As DBAs, we might not be able to see deep into this stack (or need/care to), but we get the end result of the stack in the form of performance underneath our data.
Three metrics matter to database servers (in this order):
- Latency (measured in milliseconds)
- I/Os per second (measured in IOPs)
- Throughput (Megabytes per second)
The round trip path time from your server to disk and back is the latency. High latencies mean that you highly concurrent database server just cannot get data from the storage back fast enough. It could mean a lot of things – the path between the storage and server is clogged, the storage just can’t keep up with the request (or the requests running in the background), or something else is problematic. Usually these round trips are measured in milliseconds, unless you’re on a flash or flash-hybrid array, and then the performance might be sub-millisecond.
I/Os per second is how many of these transactions you can process concurrently in a second. Faster is always better. The more you can support and sustain, the higher the overall performance and concurrency and scale improve on your servers. For perspective, a single desktop-grade SATA disk can sustain about 100 IOPs. A 15K RPM SAS disk can sustain 175 to 210 IOPs. A lower-end IP-based SAN can usually sustain in the 2500 IOPs range. Flash SANs can handle to 1M IOPs and beyond!
Throughput is a combination of block size and IOPs. If a storage unit can handle a 1000 IOPs read stream with 4KB blocks, you should be reading at 4096 KB/s, or 4MB/s throughput.
IOPs and throughput can also vary by the block size of the transaction. Most Windows NTFS-formatted volumes are formatted with the default 4KB allocation unit size. Microsoft recommends a 64KB NTFS allocation unit size for SQL Server volumes. Generally speaking, if a block size stream on a SAN/NAS doubles, the IOPs are cut in half or the throughput doubles if the storage can handle the performance. For example, on the local SSD in my workstation, we can see this very quickly with one of the utilities I’ll be exploring on this blog soon – SQLIO.

The parameter -bX is the block size, in KB. The two tests show a sequential read test on my local SSD with both 4KB and 8KB block sizes. The first test did not stress the storage to the maximum performance, so we had headroom to go up, and it did. The throughput doubled with the block size doubled.
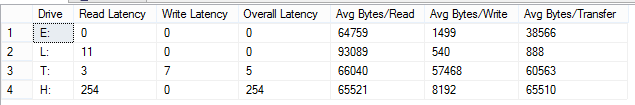
From within SQL Server, you can see this fairly easily. SQL Server keeps track of disk latencies by database file, and you can query to see the average values per drive and by file. This query came from Glenn Berry’s diagnostic queries.
| – SQL Server 2012 Diagnostic Information Queries — Glenn Berry — November 2014 — Last Modified: November 3, 2014 — http://sqlserverperformance.wordpress.com/ — http://sqlskills.com/blogs/glenn/ — Twitter: GlennAlanBerry — Drive level latency information (Query 24) (Drive Level Latency) — Based on code from Jimmy May SELECT [Drive], CASE WHEN num_of_reads = 0 THEN 0 ELSE (io_stall_read_ms/num_of_reads) END AS [Read Latency], CASE WHEN io_stall_write_ms = 0 THEN 0 ELSE (io_stall_write_ms/num_of_writes) END AS [Write Latency], CASE WHEN (num_of_reads = 0 AND num_of_writes = 0) THEN 0 ELSE (io_stall/(num_of_reads + num_of_writes)) END AS [Overall Latency], CASE WHEN num_of_reads = 0 THEN 0 ELSE (num_of_bytes_read/num_of_reads) END AS [Avg Bytes/Read], CASE WHEN io_stall_write_ms = 0 THEN 0 ELSE (num_of_bytes_written/num_of_writes) END AS [Avg Bytes/Write], CASE WHEN (num_of_reads = 0 AND num_of_writes = 0) THEN 0 ELSE ((num_of_bytes_read + num_of_bytes_written)/(num_of_reads + num_of_writes)) END AS [Avg Bytes/Transfer] FROM (SELECT LEFT(UPPER(mf.physical_name), 2) AS Drive, SUM(num_of_reads) AS num_of_reads, SUM(io_stall_read_ms) AS io_stall_read_ms, SUM(num_of_writes) AS num_of_writes, SUM(io_stall_write_ms) AS io_stall_write_ms, SUM(num_of_bytes_read) AS num_of_bytes_read, SUM(num_of_bytes_written) AS num_of_bytes_written, SUM(io_stall) AS io_stall FROM sys.dm_io_virtual_file_stats(NULL, NULL) AS vfs INNER JOIN sys.master_files AS mf WITH (NOLOCK) ON vfs.database_id = mf.database_id AND vfs.file_id = mf.file_id GROUP BY LEFT(UPPER(mf.physical_name), 2)) AS tab ORDER BY [Overall Latency] OPTION (RECOMPILE); |
You can see each drive represented here on my storage (and it’s busy in the background on one of the volumes so I can drive up some latency counters here). The latency counters are in milliseconds. Remember, these are averages, so if you have a minor blip while it runs, it can throw off the averages significantly.
 That leads me to a good transition – what do you use to actually test the storage? A lot of options are available – and most of them are free. Over the next month or so, we’ll be exploring here how to use some of my favorite free disk benchmarking utilities, including the following:
Microsoft SQLIO (with SQLIO Batch)
DiskSpd (new from Microsoft)
 Warning! Disk benchmarking utilities can put a significant strain on your storage subsystem. Unstable storage devices can actually crash under the load. Stable storage can suffer performance degradation of your workload, as well as everything else running on it. DO NOT run any storage test on a production environment without the express permission of those responsible for the environment. I will not be responsible for any disruption in service to any system that has a stress test run on it inappropriately.
 Now, with that out of the way, stay tuned for more posts soon on how to benchmark the storage underneath your SQL Servers, and how to simulate OLTP traffic on various disks with some advanced parameters of these tools!
