

There’s a war on in the SQL Server world. On the one side is Profiler (although, really, everyone uses Trace Events). On the other, the “new” (they came out in 2008 with a full GUI in 2012, so…) Extended Events. Lots of people have picked sides on this, including Microsoft.
New Trace Events
There are none.
All the new functionality of every sort from Availability Groups to Query Store to R & Python, have Extended Events created for them. Trace Events, and the technologies supporting them in the form of Profiler, are a dead end.
Don’t fear. While Trace is on the deprecation list, there doesn’t appear to be any fear of that technology being removed completely. At least it won’t be removed in the foreseeable future. A future which, when one considers annual releases, or faster, isn’t that far away.
All this means that if you wish to monitor any new functionality in any instance using 2012 or greater, then you have to use Extended Events. However, if you’re still in love with the layout provided for consuming Trace Events by the Profiler, you still get to use it.
Microsoft (and I) really wish you would move to Extended Events though. That’s why they introduced the XE Profiler in the release of SQL Server Management Studio 17.3.
XE Profiler
If you check out the Object Explorer pane in SSMS, down at the bottom, you’ll see a new folder, XE Profiler, as shown here:

Double clicking one of these shows you something that looks very familiar to those of us who have been using SQL Server since 2000 was released:
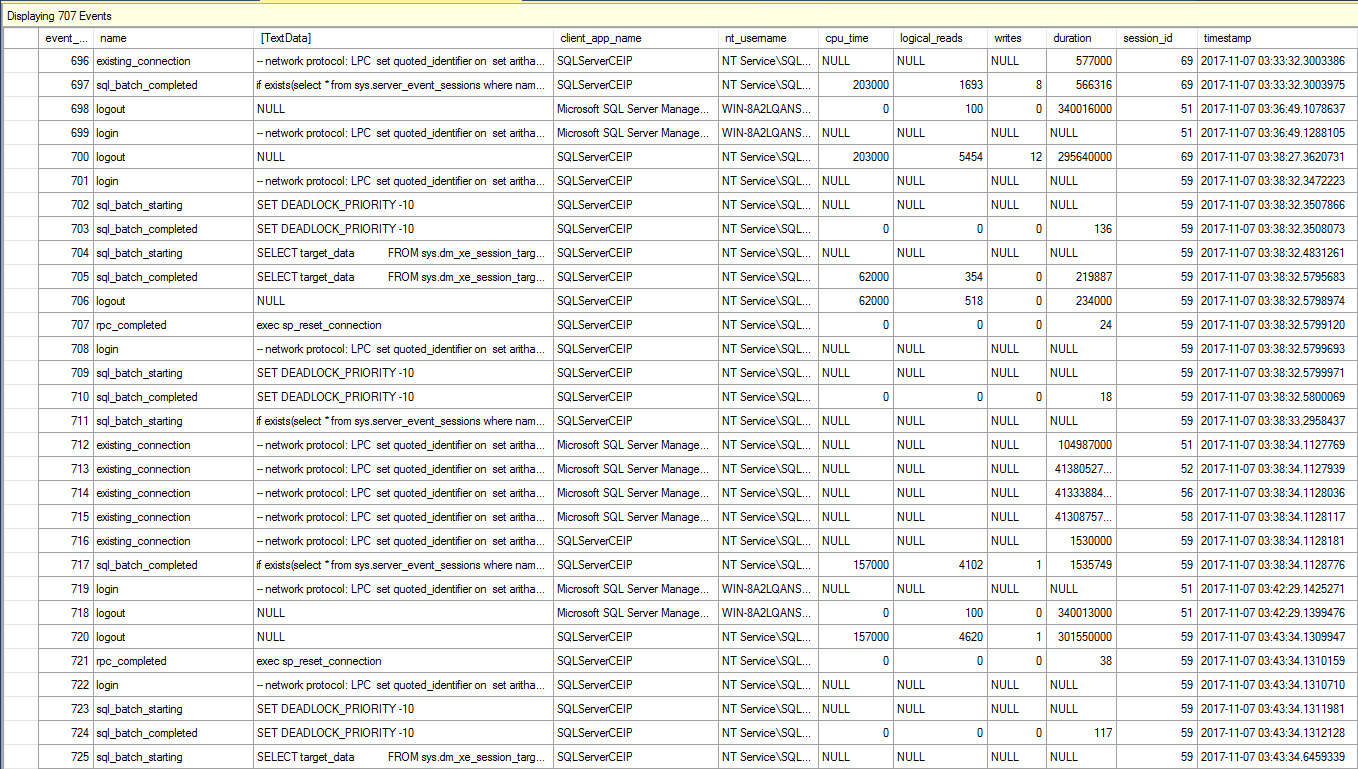
Click on that image. It looks a whole lot like the good old Profiler output that you’re used to.
WHOOP!
This means that Microsoft has finally ported Profiler and Trace Events into the modern SSMS.
Yeah, well, no. They haven’t. What they have done is something you could have done for yourself since SQL Server 2012. They created a Session for Extended Events that looks exactly like the Profiler stuff you’re used to. Then, they used the ability of the Live Data window, Extended Events GUI, to add columns from the Event package to the grid, so that the XE Profiler output looks like what you’re used to from Profiler. That’s all it is. They did some formatting for you.
End of the War?
So is this it? Is the war over? Is all that was really needed a GUI that emulated Profiler?
In my opinion, no. There is still one giant issue outstanding around the war between Trace Events (Profiler) and Extended Events. XML. See, the output of Extended Events, if you capture them to a file, is XML. You can use fn_xe_file_target_read_file to query the XML, but you still have to use XQuery to shred the output. Although you can use the Live Data to explore data, including grouping, filtering and some other really cool functionality, lots of people, myself included, would prefer to query that data directly. As long as it’s somewhat difficult to access the data from Extended Events, there’s going to be a tendency to fall back on Trace Events.
Conclusion
Microsoft is trying hard to meet us in the middle with the addition of the XE Profiler output to SSMS in 17.3. Those of us who have already picked the Extended Event side of things are probably not going to be overwhelmed by this addition. Those of us still focused on the functionality that Profiler provides may be partially swayed by this new GUI that resembles the views they hold so dear. Unfortunately, there’s still the issue of querying the data. I believe that will prevent a complete armistice from being signed, so the war is likely to continue.
The post Extended Events and Profiler: XE Profiler appeared first on Grant Fritchey.
![]()
