No matter how simple it is, new things come with some confusion; at least until you get used to it. Analysis Services 2012 Tabular is no different. This post will look at steps to create your first Tabular project.
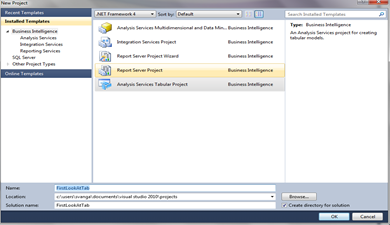
Let’s start with firing up SQL Server Data Tools located under Microsoft SQL Server 2012 RC0. I’ve selected to create a new project.
In the above image, I’ve selected Analysis Services Tabular Project.
You might see a error message similar to the one below. This happens when the server instance specified in the Workspace Server property doesn’t have an analysis services running in tabular mode. For instance, in this example the name of my instance is localhost\SQL110, but I purposefully changed it to an incorrect name to show this error.
To fix this, I’ve changed Workspace Server to the correct one from the properties of model.bim
Importing Data
The Model option located on the top allows you to create model files. You’ll begin with importing data from a source.
The next screen lets you select a type of data source. I’ve selected Microsoft SQL Server. In the next screen, you choose a server name and database name as the source.
You’ll provide impersonation information in the next screen. This is important because, analysis services uses this account to connect to the data source. So, make sure that this account has required permissions on both the server instances: data source and analysis services.
Next screen asks how you want to import the data. You can either choose from a list of tables or view, or specify a query to retrieve the data. I’ve opted to select from a list.
From the list of tables and views in the below image, I’ve selected FactInternetSales, DimProduct, DimProductSubCategory, DimProductCategory, DimCustomer, and DimGeography.
Clicking finish will complete by the data import and the next screen displays a status of the tables and views that were imported.
Toggle to the diagram view to see the tables and relationships among the objects in the model. In the below image, you’ll notice the wizard identifies the relationships in the data source.
Toggle to the grid view to see the data that was imported from data source to the model. This interface looks similar or Excel workbooks with one tab for each table in the data source.
Create Measures
The first thing you should do after importing data is to create measures. I’ll select Sales Amount and choose Sum from the measure drop down in the following image.
I’ve repeated the same steps for Tax Amount, to create another measure.
Deploy To Target Server
Before deploying to the server, take a few seconds to verify the target server properties. Target Analysis Services must be running in tabular mode.
In the below image, I’ve selected to deploy the model.
Browse Your First Tabular Model
I selected Analyze in Excel option located on the top. An excel pivot table with a connection to the model you just deployed allows you to analyze data in Excel.
Conclusion
Well, Well, Well. I know this has been a lengthy post. So I’ll let you go with no further ado, but please use the comments below should you have any questions or comments.
~Sam


