

By Steve Bolton
…………One of the key reasons I looked into the topic of fuzzy sets in the first place was my suspicion that T-SQL, as a set-based language, would be ideal for modeling them. That turned out to be an understatement of sorts: I definitely was not prepared to discover just how useful they can be for translating imprecise linguistic modifiers in Behavior-Driven Development (BDD) environments and user stories, nor did I realize how little information has percolated down from the mammoth amount of theoretical research done on fuzzy topics over the last 40 years. Hopefully this series of amateur mistutorials helped rectify that gap by giving fuzzy sets some badly needed free press, of the kind I tried to bring SSDM in my older A Rickety Stairway to SQL Server Data Mining series awhile back. I originally set aside this final article as a kitchen drawer of sorts, to dispense with some postscripts that would’ve interfered with the flow of the rest of the series, in which one concept was used as a building block onto the next. One leftover concept I thought might be worthy of significant attention was fuzzy orders, which sounds as if it would be right up SQL Server’s alley. After all, DBAs use the ORDER BY statement every day. The problem is that it turns out T-SQL, like most other set-based languages, is not ideal for modeling this kind of fuzzy object.
Fuzzy Orders and the Limitations of Hierarchies in SQL
In the literature, fuzzy set orders are created by applying continuous membership grades to a record’s position in a particular fuzzy set. Devices like Hesse diagrams and properties like “dominated” and “undominated” are useful in implementing them[1], but I won’t bother, for the simple reason that SQL Server lacks robust graph database capabilities. Modeling relationships of this kind is still notoriously difficult in the relational realm, even though they’ve been augmented by such useful tools as hierarchyid data type in recent years. I am rather fond of hierarchyid, but it is unable to model multiparent trees in an efficient way, let alone multidimensional directed graphs. Just try modeling a simple genealogical tree with it. Trees are instances of what are known in mathematical parlance as partial orders; when you really stop and think about it, they represent a form of order, except in more than one dimension, such as “my grandparents and I have a descendant-ancestor relationship, but not my cousins and I.”[2] As far as I can tell, directed graphs open up more possibilities by relaxing the rules of composition, in the same way the Riemann manifolds give us access to curved hyperspace. I for one would cast my vote for adding graph database capabilities similar to those found in Neo4j[3] to SQL Server, which would add a whole new dimension to the product in the same way that Analysis Services and Reporting Services do, without being a separate service.
…………Alas, until such capabilities are added to SQL Server, it wouldn’t be useful to model most forms of fuzzy orders in T-SQL, let alone Multidimensional Expressions (MDX) in SQL Server Analysis Server (SSAS) cubes, because they immediately require the flexibility of multiparent trees and directed graphs. These tasks could be accomplished in SQL Server 2014 as it stands, but in contrast to the other fuzzy objects I’ve introduced throughout this series, I doubt it can be done in an efficient way. It also doesn’t help matters at all that the Windows Presentation Foundation (WPF) tree control is a walking disaster – for years now, its shortcomings have been a thorn in the side of .Net developers of all skill levels. Microsoft simply didn’t build in such basic functionality as searching for specific members in a collapsed tree, and in fact made it virtually impossible for third-party developers to do it themselves. Needless to say, neither the WPF TreeView nor hierarchyid is well-suited to modeling directed graphs, which are simply a more flexible generalizations of trees. The kissing cousins of fuzzy orders, like fuzzy rankings[4] and fuzzy morphisms[5], aren’t really feasible either. George J. Klir and Bo Yuan’s Fuzzy Sets and Fuzzy Logic: Theory and Applications, my favorite go-to resource for fuzzy math formulas, provides a decent starting point for all three[6], but from my little experience, I wouldn’t even try to implement them unless I had access to a good third-party product like GoXAM’s directed graph control (which may be expensive, but would probably recoup its costs by saving weeks of wasted labor on the unworkable WPF TreeView). If it one day does become worthwhile to model fuzzy orders and ranks in some future edition of SQL Server (or I turn out to be wrong), they’ll probably require the use of a lot of CASE statements in ORDER BY clauses and windowing functions, respectively. Given that there’s a mountain of currently unsolved problems out there that other aspects of fuzzy sets could tackle right away, we’ll save this topic for a later date. It’ll be a long time before all the low-hanging fruit is used up and we’re to the point where struggling to model them will become worthwhile.
Some Simple T-SQL for Fuzzy Medians
Because I realized early on that fuzzy orders were an afterthought – at least by the present capabilities of SQL Server and other relational databases – I left the subject of fuzzy medians for this junk drawer of an article. After all, medians are inherently dependent on the order of data, given that the pick the one or two values that occur precisely in the middle of a set. Furthermore, I noticed that the formulas involved calculations on two sets rather than one, which would have cluttered Implementing Fuzzy Sets in SQL Server, Part 7: The Significance of Fuzzy Stats, where the sample code was all done on a single table. That should have been a clue, however, that the fuzzy medians in the literature are a separate subject, not just a fuzzified version of ordinary medians. That would be easy enough to implement, given the principles of fuzzy sets introduced throughout this series; for example, instead of selecting the one or two records at the dead center of the dataset, we could select a fuzzy range. The trapezoidal numbers discussed in Implementing Fuzzy Sets in SQL Server, Part 6: Fuzzy Numbers and Linguistic Modifiers might be ideal for this purpose. The type of fuzzy medians under discussion here instead belong in the taxonomic hierarchy of fuzzy objects I mentioned in the fuzzy stats article, like Ordered Weighted Averages (OWAs), Lambda Averages (?-Averages), T-norms, T-conorms and the like. Compared to some of those operations, the logic of fuzzy medians is fairly simple: we take the maximum of the values of two sets at each corresponding row when both membership scores are between 0 and the @LambdaParameter, the minimum values when both are between the @LambdaParameter and 1 and just the @LambdaParameter (which must be set between 0 and 1) in all other cases.[7] Assuming I read the formulas correctly – which is not a given, since I’m a novice at this – then this should all be implemented in Figure 1. As usual, it looks a lot longer than it really is; everything through the second UPDATE statement is just the same sample code I’ve used this series to populate the membership functions for binary set relations. Keep in mind that we don’t need to use Z-Scores to assign membership values here; I’m just using them to illustrate how to assign memberships in a fuzzy set, using familiar code from older tutorials. The sky’s the limit as far as the number of functions you can use to assign such values; the key thing is to find the right match to the problem you’re trying to solve. This would be a good match if we were trying to rate outliers by two different forms of Z-Scores, for example. The only novel part is the last SELECT, which isn’t difficult at all. As always, the results in Figure 2 are derived from the Duchennes muscular dystrophy dataset I downloaded a few tutorial series ago from Vanderbilt University’s Department of Biostatistics and have been using for practice data ever since.
Figure 1: Sample Code for a Simple Fuzzy Median
DECLARE @RescalingMax decimal(38,6), @RescalingMin decimal(38,6), @RescalingRange decimal(38,6)
DECLARE @ZScoreTable table
(PrimaryKey sql_variant,
Value decimal(38,6),
ZScore decimal(38,6),
ReversedZScore as CAST(1 as decimal(38,6)) – ABS(ZScore),
MembershipScore decimal(38,6),
GroupRank bigint
)
DECLARE @ModifiedZScoreTable table
(PrimaryKey sql_variant,
Value decimal(38,6),
ZScore decimal(38,6),
ReversedZScore as CAST(1 as decimal(38,6)) – ABS(ZScore),
MembershipScore decimal(38,6),
GroupRank bigint,
OutlierCandidate bit
)
INSERT INTO @ZScoreTable
(PrimaryKey, Value, ZScore, GroupRank)
EXEC Calculations.ZScoreSP
@DatabaseName = N’DataMiningProjects‘,
@SchemaName = N’Health‘,
@TableName = N’DuchennesTable‘,
@ColumnName = N’LactateDehydrogenase‘,
@PrimaryKeyName = N’ID’,
@DecimalPrecision = ’38,32′,
@OrderByCode = 8
— RESCALING
SELECT @RescalingMax = Max(ReversedZScore), @RescalingMin= Min(ReversedZScore)
FROM @ZScoreTable
SELECT @RescalingRange = @RescalingMax – @RescalingMin
UPDATE @ZScoreTable
SET MembershipScore = (ReversedZScore – @RescalingMin) / @RescalingRange
INSERT INTO @ModifiedZScoreTable
(PrimaryKey, Value, ZScore, GroupRank, OutlierCandidate)
EXEC Calculations.ModifiedZScoreSP
@DatabaseName = N’DataMiningProjects‘,
@SchemaName = N’Health‘,
@TableName = N’DuchennesTable‘,
@ColumnName = N’LactateDehydrogenase‘,
@PrimaryKeyName = N’ID’
@OrderByCode = 8,
@DecimalPrecision = ’38,32′
— RESCALING
SELECT @RescalingMax = Max(ReversedZScore), @RescalingMin= Min(ReversedZScore)
FROM @ModifiedZScoreTable
SELECT @RescalingRange = @RescalingMax – @RescalingMin
UPDATE @ModifiedZScoreTable
SET MembershipScore = (ReversedZScore – @RescalingMin) / @RescalingRange
DECLARE @LambdaParameter float = 0.43
SELECT T1.PrimaryKey, T1.Value, T1.MembershipScore, T2.MembershipScore,
CASE WHEN (T1.MembershipScore BETWEEN 0 AND @LambdaParameter) AND (T2.MembershipScore BETWEEN 0 AND @LambdaParameter) THEN (SELECT MAX(Value) FROM (VALUES (T1.MembershipScore), (T2.MembershipScore) ) AS T1(Value))
WHEN (T1.MembershipScore BETWEEN @LambdaParameter AND 1) AND (T2.MembershipScore BETWEEN @LambdaParameter AND 1) THEN (SELECT MIN(Value) FROM (VALUES (T1.MembershipScore), (T2.MembershipScore) ) AS T1(Value))
ELSE @LambdaParameter END AS FuzzyMedian
FROM @ZScoreTable AS T1
INNER JOIN @ModifiedZScoreTable AS T2
ON T1.PrimaryKey = T2.PrimaryKey AND T1.Value IS NOT NULL AND T2.Value IS NOT NULL
Figure 2: Results from the Duchennes Dataset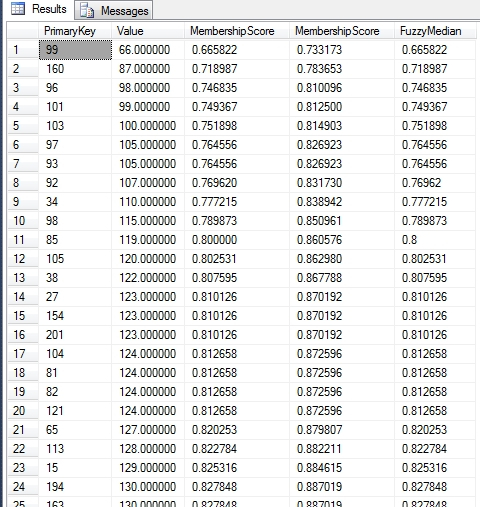
…………I barely began to scratch the surface of fuzzy objects like fuzzy medians, ?-Averages, T-norms, T-conorms and OWAs in this series. In fact, there’s an entire sea of ripe research out there on all topics fuzzy that could be quite useful to relational DBAs and decision support specialists, but which has gone unpicked. There are many different directions this topic can be taken in, so I may revisit this series and tack some additional articles onto it in the future. I didn’t get a chance to mention the extension principle[8] at all and glossed over important applications of fuzzy techniques in Decision Theory, way back in Implementing Fuzzy Sets in SQL Server, Part 4: From Fuzzy Unions to Fuzzy Logic. I might provide more detail on the use cases for particular T-norms and T-conorms (if I can ever get my hands on the relevant academic journal articles, which are expensive), model more linguistic states and get into indexing considerations, other brands of fuzzy aggregates and other types of fuzzy partitions besides alpha cuts (a-cuts), among other things. Yet I’d rather branch off into “soft computing,” which is a grab-bag and hodge-podge of cutting edge fields that are quite hard, which make its name something of an oxymoron. Fuzzy logic is merely one of the buzz words associated with it, like chaos theory, neural nets, support vector machines (SVMs) and genetic algorithms. What they all have in common is that they’re useful in situations where inexact solutions are acceptable, including NP-Complete problems.[9] The same hype and intellectual intoxication I spoke of in Implementing Fuzzy Sets in SQL Server, Part 1: Membership Functions and the Fuzzy Taxonomy also surrounds certain aspects of soft computing, which seems to make some theoreticians go soft in the head; I guarantee there will still be useful innovations occurring in these fields a century from now, assuming the human race lasts that long, but these incredible tools aren’t cure-alls. There are some things they just can’t do and I’d wager that certain brands of artificial intelligence and machine learning are among them; I love science fiction but it’s not wise to confuse it with cold, hard reality.
…………That’s a discussion I’ll take up by dribs and drabs in my next, long-delayed mistutorial series, Information Measurement with SQL Server, which may serve as stepping stone to my favorite topic, neural nets. Both topics dovetail nicely with fuzzy sets and many of the tangential topics we’ve covered in this series, like Shannon’s Entropy and the Hartley function. These are among dozens of metrics which can be coded in T-SQL and Multidimensional Expressions (MDX) and put to good use for data mining purposes, as I will demonstrate over the course of this long and possibly nomadic series. I aim to familiarize myself with semantic information, measures of order, measures of sensitivity to initial conditions (like the Lyapunov Exponent used in chaos theory), various means of quantifying algorithmic complexity – anything that will reduce uncertainty and glean whatever unused information is left in our datasets, by quantifying it in some way. Some of these metrics can be plugged into the formulas I introduced in this series for measuring fuzziness in terms of set complements, such as the Küllback-Leibler Divergence and Bhattacharyya Distance. We’ve already gotten our toes wet by introducing fuzzy stats and metrics for quantifying nonspecificity and fuzziness; now it’s time to jump in. Some of the topics will be quite shallow and easy to follow, while others may be incredibly deep. It’s largely unexplored territory for me as well, so I may have to skip around from topic to topic in an unsystematic way, instead of deliberately building up to more complex concepts as I did towards Dempster-Shafer Evidence Theory in this series. At a minimum, readers should at least benefit from learning from my mistakes, which don’t require a fancy fuzzy expert system to tell us that they’re inevitable; like death and taxes, they’re one of the few pieces of information that come with any certainty in predictive analytics and data mining.
[1] pp . 137-141, Klir, George J. and Yuan, Bo, 1995, Fuzzy Sets and Fuzzy Logic: Theory and Applications. Prentice Hall: Upper Saddle River, N.J. On this particular page, they’re extending the meaning of the term even further, to complex network topologies.
[2] For more information, see the article “Partially Ordered Set” at the Wikipedia web address http://en.wikipedia.org/wiki/Partially_ordered_set
[3] Which I have yet to try; I’m only speaking here of what’ve read about Neo4j casually.
[4] pp. 405-408, Klir and Yuan.
[5] IBID., pp. 141-144.
[6] IBID., pp. 137-144,
[7] IBID., p. 94.
[8] IBID., pp. 44-45.
[9] See the Wikipedia article “Soft Computing” at http://en.wikipedia.org/wiki/Soft_computing.
