

By Steve Bolton
…………To get the point across that fuzzy sets require membership grades of some sort, throughout this series I’ve borrowed the stored procedure I coded for Outlier Detection with SQL Server, part 2.1: Z-Scores and rescaled the results on the customary range of 0 to 1. The literature on fuzzy sets contains frequent warnings against automatically interpreting membership scores as probabilities, but I deliberately introduced a tie-in to stochastics by using Z-Scores, which are inherently probabilistic. Other shades of meaning may be assigned which are unfamiliar to modelers of ordinary “crisp” sets, which is why I pointed out early on in this series of amateur self-tutorials that interpretability is a more prominent issue with fuzzy sets. For example, membership functions can be viewed as assigning scores to the accuracy of the associated values, which is similar to the way in which we used fuzzy numbers two articles ago to code such linguistic concepts like “about” and “near.” If we add the subtle distinction that the membership scores may mean “cannot be near” or “can be around” a certain value, we’re stepping into the realm of Possibility Theory, which has important uses in fuzzy logic.
…………Approximate reasoning and related concepts are more relevant to topics like expert systems that are beyond the purview of this series, but Possibility Theory can serve as a useful springboard into Evidence Theory, which is useful in developing programs of uncertainty management. Possibility distributions are in one sense a more restricted brand of probability distributions, while also acting as more restrictive versions of Evidence Theory measures; it may therefore be easier to use them as bridge from one relatively familiar topic to a lesser-known one. I originally thought the topic would be quite difficult to grasp, but it’s actually a good deal easier that stochastics. Perhaps the most difficult aspect is that possibility distributions can be modeled using alpha cuts (a-cuts), a method of partitioning fuzzy sets that will prove useful in the next two articles to come.
From ‘Can’ and ‘Must’ to Surprise
In fact, I’ll lighten the load further by dispensing with many of the details of Possibility Theory, since its simplicity can quickly give way to complexity, same as with any other fuzzy set topic. For example, stochastic concepts like conditional and marginal probabilities have their counterparts in Possibility Theory, all of which is too far afield for our purposes. For those have a need for the corresponding formulas and don’t mind wading through the thick math, I recommend consulting the seventh chapter of my favorite resource, George J. Klir and Bo Yuan’s Fuzzy Sets and Fuzzy Logic: Theory and Applications. I’m not even going to get into a discussion of how possibility scores are assigned; for the sake of argument, let’s assume any figures used in my examples are derived from subjective ratings by end users. The important thing to keep in mind is that we need two numbers to specify a possibility distribution, not just the single probability figure used in stochastics. One of these is known as the Possibility measure and the other as a measure of Necessity, which is the inverse of Possibility’s complement.
…………The two measures can be combined by adding them together and subtracting one, but the fact that this results in a non-standard range of -1 to 1 limits its usefulness.[ii] The simplest way to model this relationship is to use a bit column, in conjunction with the float, numeric or decimal columns normally used to represent fuzzy sets on a continuous scale between 0 and 1.[iii] The tricky thing is that an event must occur when Necessity equals 1, whereas a Possibility score of 0 means that it cannot; on the other hand, a Possibility score of 1 does not imply certainty, only a state of total surprise if it did; apparently this in analogous to a measure of “surprise” developed in the mid-20th Century by economist G. L. S. Shackle,[iv] which has since been further developed by such household names in the fuzzy set field as like Henri Prade and Ronald R. Yager.[v] As Lofti A. Zadeh, the father of fuzzy set theory, explains it:
“Consider a numerical age, say u = 28, whose grade of membership in the fuzzy set ‘young’ is approximately 0.7. First we interpret 0.7 as the degree of compatibility of 28 with the concept labelled young. Then we postulate that the proposition ‘Peter is young’ converts the meaning of 0.7 from the degree of compatibility of 28 with young to the degree of possibility that Peter is 28 given the proposition ‘Peter is young.’ In short, the compatibility of a value of u given ‘Peter is young.’”[vi]
…………This lack of symmetry is comparable to the way possibilities and probabilities differ. A Necessity measure of 1 leads inevitably to a probability score of 1, since what must happen is entirely probable; conversely, a Possibility measure of 0 leads to a probability score of 0, since what cannot happen is entirely improbable. Apart from these extremes, however, the two theories diverge. A Necessity or Possibility score of 0.5 has no effect on the probability, since whether or not a thing is logically conceivable is not equivalent to whether it is likely to happen; it is entirely possible that we may win the lottery tomorrow, but I wouldn’t bet on it. This is the core difference between the two theories: one expresses confidence in our information about whether a thing can happen, while the other reflects confidence in information about whether it will.
…………Because of this relationship, a possibility distribution acts as a cap on the associated probability distribution; this has many mathematical consequences[vii], the most important of which is that the two distribution types intersect at their minimum and maximum values. This in turn leads to the interesting property that possibility scores do not have to sum to 1 across a set of records, unlike probabilities; the only restriction is that the maximum value per record is 1.[viii] This in turn means that to assess whether or not we’ve reached a certain threshold of possibility values, all of the records with scores greater than the threshold must be taken into account. In other words, if we want to know if an event has a possibility of 0.3, we must examine all of the records with scores higher than that to come to a verdict. Every record in a set will qualify for the lowest partition, where a possibility score of 0 is all it takes to qualify, but the number of records continually shrinks as we move up the dataset towards the perfect score of 1.
Nested Sets and a-cuts
This creates a nested set of evidence in which records can belong to multiple partitions, which can be easily implemented in T-SQL despite the fact that it calls for thinking about sets in unusual ways. We’re doing something uncommon here by cutting a set up hierarchically, so that a row belongs to more and more sets as we approach the maximum value of the membership function, rather than a single subset as we see in most relational joins. Klir and Yuan include a couple of handy illustrations which could get across the meaning of nested sets of evidence in a heartbeat, but I haven’t had a chance to seek permission to reprint them and don’t have the ability to draw my own.[ix] In turns out that the fuzzy set partitioning method known as a-cuts are an ideal tool for implementing these relationships[x] (not to mention many others that are beyond the scope of this series, like fuzzy equivalence relations[xi]). In plain English, this means that we have to use >= comparison operators to chop up a dataset into nested subsets, or > operators in the case of strong a-cuts.
…………I’m trying to keep the jargon to a minimum, but since the terms “cutworthy” and “strong cutworthy” occur frequently in the literature, it may be helpful to know that they refer to mathematical properties of fuzzy sets which are preserved in their a-cuts. [xii] Another important property is reconstructibility, which means that a fuzzy set can be rebuilt from its partitions. The manner in which possibility distributions establish maximum values for their associated probability distributions is essentially one and the same as the min/max types of unions and intersections we dealt with in previous articles, while the possibilities themselves are defined by their a-cuts.[xiii]
…………The first SELECT statement in Figure 1 illustrates how a simple GROUP BY and SUM with a ROWS UNBOUNDED PRECEDING clause can be used to partition a SQL Server table in this unconventional manner. I also have an alternate version of these SELECTs in which partitioning is done by deciles (or any other arbitrary percentile value) rather than DISTINCT MembershipScores, which I omitted to keep things simple; if anyone needs it though, I’d be happy to post it. As usual, the sample data comes from a dataset on the Duchennes form of muscular dystrophy I downloaded from Vanderbilt University’s Department of Biostatistics a few tutorial series ago, which now resides in a sham DataMiningProjects database. The code from the beginning to the UPDATE statement is basically identical to the T-SQL samples I’ve posted throughout this series, which always begins with plugging the results of the aforementioned Z-Score procedure into a table variable. The GroupRank column is only included because it was part of the original procedure and can’t be omitted from the INSERT EXEC, but it can be safely ignored. The @Rescaling variables and the ReversedZScore column are then used to adjust the Z-Scores to the 0 to 1 range used in almost all fuzzy sets. There are only 202 records in the DuchennesTable where LactateDehydrogenase where is NOT NULL, which is exactly equal to the count of values in Figure 2 where the MembershipScore is zero. The counts for each a-cut continually decline after that, till they reach the perfect score of 1, which is equivalent to the Height measure mentioned in last week’s article on fuzzy stats. I left out the middle values for the sake of brevity.
Figure 1: An Example of a-Cut Partitioning
DECLARE @RescalingMax decimal(38,6), @RescalingMin decimal(38,6), @RescalingRange decimal(38,6)
DECLARE @ZScoreTable table
(PrimaryKey sql_variant,
Value decimal(38,6),
ZScore decimal(38,6),
ReversedZScore as CAST(1 as decimal(38,6)) – ABS(ZScore),
MembershipScore decimal(38,6),
GroupRank bigint
)
INSERT INTO @ZScoreTable
(PrimaryKey, Value, ZScore, GroupRank)
EXEC Calculations.ZScoreSP
@DatabaseName = N’DataMiningProjects‘,
@SchemaName = N’Health‘,
@TableName = N’DuchennesTable‘,
@ColumnName = N’LactateDehydrogenase‘,
@PrimaryKeyName = N’ID’,
@DecimalPrecision = ’38,32′,
@OrderByCode = 8
— RESCALING
SELECT @RescalingMax = Max(ReversedZScore), @RescalingMin= Min(ReversedZScore) FROM @ZScoreTable
SELECT @RescalingRange = @RescalingMax – @RescalingMin
UPDATE @ZScoreTable
SET MembershipScore = (ReversedZScore – @RescalingMin) / @RescalingRange
— ALPHA CUTS BY DISTINCT VALUES
— =======================================
SELECT MembershipScore, SUM(DistinctCount) OVER (ORDER BY MembershipScore
DESC ROWS UNBOUNDED PRECEDING) AS AlphaCutCount
FROM (SELECT MembershipScore, Count(*) AS DistinctCount
FROM @ZScoreTable
WHERE MembershipScore IS NOT NULL
GROUP BY MembershipScore) AS T1
— MEASURE OF SURPRISE
— =======================================
SELECT ID, LactateDehydrogenase, NecessityMeasure, PossibilityScore, 1 – PossibilityScore AS SimpleMeasureOfSurprise
FROM Health.DuchennesTable
WHERE LactateDehydrogenase IS NOT NULL
Figure 2: Sample a-Cut Values from the Beginning and End of the Duchennes Dataset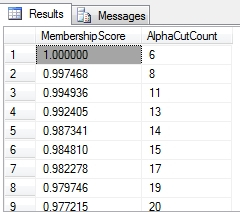
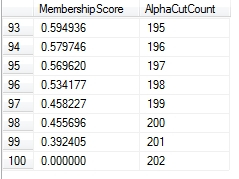
Figure 3: Possibility Scores and the Measurement of Surprise
…………The second SELECT merely returns some fake PossibilityScore values I randomly generated and tacked onto the DuchennesTable, with a simple inverse calculation to illustrate the most basic measure of Surprise.[xiv] Authors like Prade and Yager have extended the measure to address more sophisticated use cases, but Figure 2 is sufficient to get the point across for our purposes. The interpretation of any Surprise measure is straightforward: the higher the value, the greater our bewilderment will be if the associated event occurs. In this context, the Surprise would be attached to the possibility of observing the corresponding LactateDehyrogenase value; of course, these are actual values taken from a muscular dystrophy in the 1980s, so if we weren’t using this for practice purposes we’d have to assign Necessity values of 1. These measurements of qualities like Surprise are of course not perfect, but they do allow us to attach some sort of ballpark figure to our expectations. As we shall see in the next two articles, one of the primary uses of fuzzy sets is to measure uncertainty, which can be valuable even when those measures are themselves uncertain. Two articles from now we’ll see how possibility theory is useful not merely in measuring surprise or in deriving interval-valued probabilities[xv], but also as a bridge to Dempster-Shafer Evidence Theory, which is useful in reckoning subtypes of uncertainty like Strife, Discord and Conflict. In the next installment, I’ll explain how both possibility distributions and a-cuts can measure nonspecificity, which is one of several types of uncertainty we can quantify with the aid of fuzzy sets.
p. 200, Klir, George J. and Yuan, Bo, 1995, Fuzzy Sets and Fuzzy Logic: Theory and Applications. Prentice Hall: Upper Saddle River, N.J.
[ii] IBID., p. 198.
[iii] I got this idea from the Wikipedia article “Possiblity Theory” at http://en.wikipedia.org/wiki/Possibility_theory.
[iv] IBID.
[v] Prade, Henri and Yager, Ronald R., 1994, “Estimations of Expectedness and Potential Surprise in Possibility Theory,” pp. 417-428 in International Journal of Uncertainty, Fuzziness and Knowledge-Based Systems, December 1994. Vol. 2, No. 4. Available online at the National Aeronautics and Space Administration (NASA) web address http://ntrs.nasa.gov/archive/nasa/casi.ntrs.nasa.gov/19930020329.pdf
[vi] Posted by Kornelia Brutoczki July 4, 2001 at the Fuzzy Logic Home Page address http://mazsola.iit.uni-miskolc.hu/DATA/diploma/brutoczki_kornelia/fu_gz_02.html. The original source is not given.
[vii] pp. 206-207, Klir and Yuan.
[viii] IBID., p. 204.
[ix] IBID., pp. 24, 195.
[x] IBID., pp. 19-21, 35.
[xi] IBID., p. 133.
[xii] IBID., p. 23, 25, 36.
[xiii] IBID., pp. 187-188, 198.
[xiv] See Prade and Yager, 1994.
[xv] p. 205, Klir and Yuan.
