

ANOVA – or analysis of variance, is a term given to a set of statistical models that are used to analyze differences among groups and if the differences are statistically significant to arrive at any conclusion. The models were developed by statistician and evolutionary biologist Ronald Fischer. To give a very simplistic definition – ANOVA is an extension of the two way T-Test to multiple cases.
Using the same dataset from previous post – the chicken feed one, let us analyze this further. The inference from the boxplot drawn in previous post was that the weight of the chickens is lowest when they are fed horsebean and highest when they are fed casein or sunflower. There were also lots of overlaps in weights. Our objective here is to determine if the average weight of chickens is significantly different based on feed, or is it more or less the same, which means the feed is really not that important to consider? We will define our null hypothesis(the statement to prove or disprove) as the average being the same and hence type of feed has no real consequence.
Null Hypothesis:H0: There is no correlation between feed type and weights.
Alternate Hypothesis:H1: There is significant correlation between feed type and weights.
What ANOVA does is calculate F statistic = Variation among sample means/Variation within groups. The higher the value of this statistic, the greater is the chance that variation among sample means is significant.
Running this simple test on chickwts dataset as below:
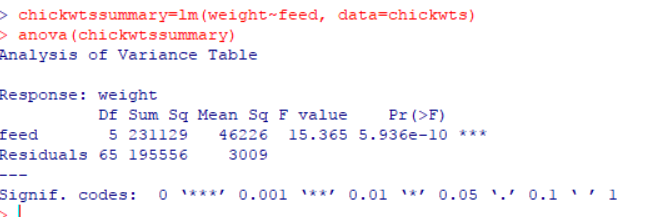
From this we can see that the F value is 15.365(Large is > 1), and the p value is really really small(to remember that ‘small’ is <0.05). So we can say with confidence that difference in weights between different feeds is way higher than difference in weight within same feed. In other words feed does appear to have an impact on weight. So we accept the alternate hypothesis.
Taking this one step further – what are the types of feed that cause significant weight differences? To understand this we perform what is called a Tukey’s HSD test, that compares each value to every other and helps us understand which pairs are significant.
It just takes a couple of lines of R code to do this – as below:

How to read/interpret the results of this test? Let us take the first line. The difference in weight with horsebean and casein is -163, which means casein is 163 points above horsebean. Since the p value is 0, the chances of this being significant are really small, as we can see with lower and upper limit values. So this is really not the pair we are looking for. Going down the list, the ones with significant p values (> 0.05) are meatmeal-casein, sunflower-casein, linseed-horsebean, meatmeal-linseed, soybean-linseed, soybean-meatmeal and sunflower-meatmeal. This can also be drawn in graphical form as below (i could not get R to shorten the text names but the ones beyond 0 are significant). The pairs with significant differences are the ones worthy of pursuit on which feed to adopt. Thanks for reading!

