 Many organizations collect data, lots and lots of data. We have the opportunity and ability today to collect more data than ever before. The challenge is turning the massive amounts of data into usable and actionable information and putting that information into the hands of those who need it when they need it. To do that effectively requires some forethought and planning. Unfortunately, many organizations stop at the data collection phase. Transforming the data into information and reporting that to users is almost an afterthought. The result is static and hard-to-interpret reports similar to the financial ledger books of the days of old.
Business Intelligence Developers Studio for Microsoft SQL Server 2008 Reporting Services, BIDS for short, makes creating engaging and dynamic reports nearly trivial in many respects. You can easily create drill-down reports that allow users to initially see a high-level overview of the information they need and then drill down into specific areas of interest with just a few clicks of the mouse. You can also create drill-through reports that allows users to seamlessly navigate from one report to another.
One dynamic feature that many users find very useful is known as Interactive Sorting. With Interactive Sorting, users can click on column headings in the Tablix data region and have the report automatically sort by that column. Let’s walk through a graphical example to demonstrate.
Sample Customer Report
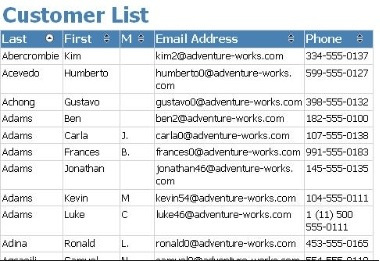
Here’s an example of a contact phone list report created in BIDS. It lists contacts from the sample Adventureworks database using a Tablix data region.
 Right now, the report shows the list of customers in no particular order. Let’s provide a way for our users to sort the list as they wish. In the Layout view, click the Tablix header cell for the Last Name column to select it, right click, and then choose Text Box Properties from the context menu.

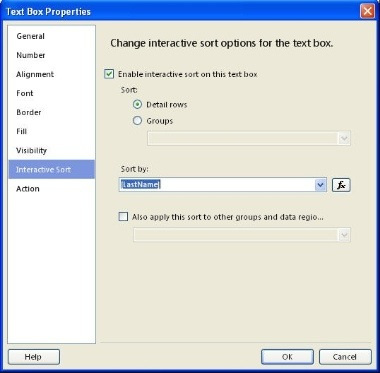
A new window will open. Click on the Interactive Sort link on the left hand side of the window.

To allow users to dynamically sort the report, check the Enable interactive sort on this text box check box. For this simple example, we’ll sort on the Detail Row by the LastName column.
Click the Ok button to save the changes and close the window. Repeat the process for each column you would like to have sortable. In this example, we’ll enable it for every column in the report.
When we preview the report again, you’ll notice that each column now has a couple of arrows in the header.

By clicking on one of the column header arrows, the sort order of the rows will dynamically change.

And there you have it. With only a few mouse clicks, we’ve enriched the experience our users have while viewing this report. Of course, this technique only works when the report is rendered in formats that support interactivity. When being viewed as a TIFF, for example, the user will not be able alter its presentation.


