

If you were used to documenting your SSAS model using the MDSchema rowsets, you might have noticed that some of them do not work with the new tabular models. For example, the MDSCHEMA_MEASUREGROUP_DIMENSIONS DMV seems to just return one row per table rather than a list of the relationships between tables.
Not to worry, though. With the new compatibility level 1200 SSAS Tabular models came some new DMVs. They are, unfortunately, not documented at this time (as of 3 Oct 2016). I expect them to show up here at some point in the future. Until then I published a Gist that provides a list of those views as well as some notes on what kind of useful info is in each one. While there are 36 TMSCHEMA DMVs, the main DMVs you will want to check out for model documentation purposes are:
- TMSCHEMA_COLUMNS
- TMSCHEMA_MEASURES
- TMSCHEMA_MODEL
- TMSCHEMA_RELATIONSHIPS
- TMSCHEMA_TABLES
There are a few fields that show IDs rather than descriptions (e.g., ExplicitDataType in TMSCHEMA_COLUMNS, Type in TMSCHEMA_DATA_SOURCES). I’ve been able to figure out the descriptions that correspond to some of the values, but I’m still missing a few.
As with the MDSCHEMA DMVs, the TMSCHEMA DMVs can be used to document your model. This also works with Power BI models. You’ll just need to change the connection information to your Power BI instnce while the .pbix file is open in Power BI Desktop. For more information analyzing your Power BI model, see Chris Webb’s post. Since DMVs require DMX queries, you are somewhat limited in your ability to join the data from the DMVs together. This makes it necessary to store the data somewhere before transforming and merging them. Since I needed to document a tabular model for a client, I created a Power Pivot model in Excel 2016. You can download my documentation model here. My example model was connected to a quick demo SSAS model I made based upon the Wide World Importers DW database.
My Power Pivot Model
My Power Pivot model uses Power Query to import the data from the DMVs. This enables me to merge data into a model that I feel makes the most sense and doesn’t suffer from too many relationships and hidden tables (which is what would happen if you just imported the results of each DMV query into the model). In order to make this work for any model, I employed a trick I learned from Chris Webb to avoid duplicating connection information across queries. I built my model with the normal embedded connection strings and then converted them to use the connection Connection Info tables. As I did that, I ran into a Power Query limitation as evidenced by the error message below.
“Formula.Firewall: Query ‘QueryName’ (step ‘StepName’) references other queries or steps and so may not directly access a data source. Please rebuild this data combination.”
Ken Puls has a great explanation of how to get around this issue. Basically, you have to redesign your queries so that you have “staging tables”, which you can then use to build finalized tables. This redesign gets you around the error since the finalized tables don’t have the embedded source connection, just a reference to the results from another query.
This Excel file documents:
- Database and model info
- Tables and source queries
- Columns
- Hierarchies
- Measures
- KPIs
- Security roles, membership, and permissions
- Relationships
- Perspectives and the columns, hierarchies, and measures they contain
The Database Info tab uses cube functions to display the values shown. The rest of the tabs use pivot tables and slicers.
You can download and use this model if you have Excel 2016 or 2013 with Power Query. Just download the file, change the values in the TabularInstanceName and TabularDBName queries, and refresh. I was able to open the file and update the queries with no issues and no changes in Excel 2013.
This is great if you just need documentation or a quick way to look up specific information. But we could really analyze this using visualizations other than tables in Power BI Desktop.
My Power BI Model
I imported the Excel model into Power BI, made a few adjustments, and then added some visualizations. This report is a bit paired down from a visualization standpoint compared to the Excel file because I eliminated some of the data that wasn’t analytically relevant for me.
Click here to view this report in Power BI.
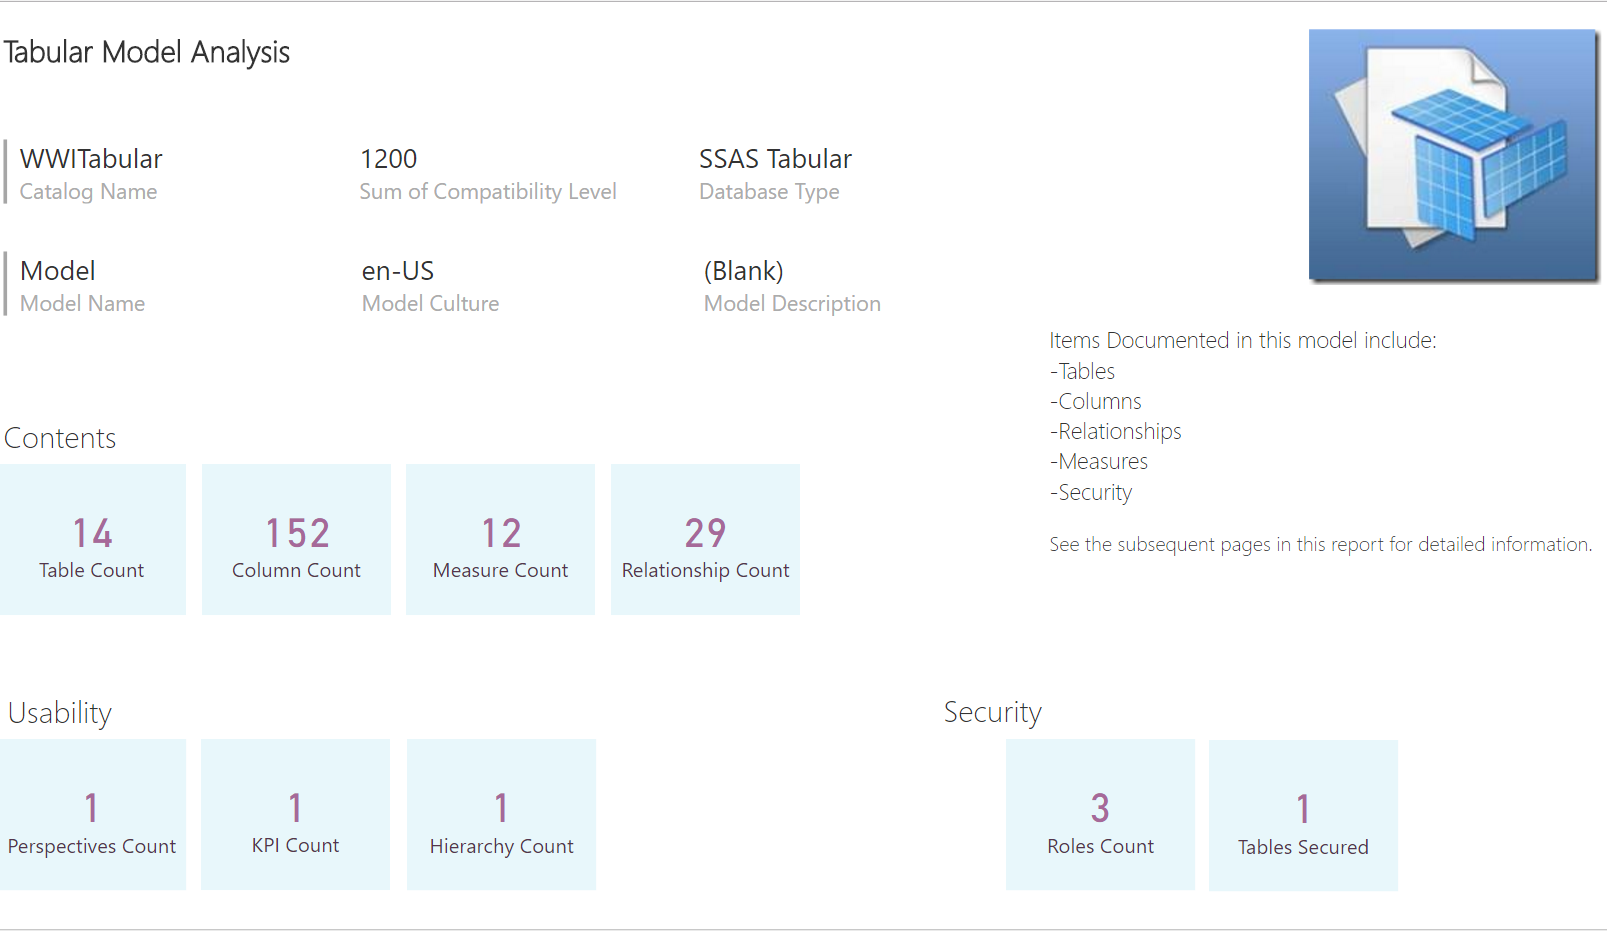
On the first page, I have several summary numbers that tell me about the contents of the model. It gives me a decent idea of the size and complexity of the model.
The second page uses a bar chart as an interactive filter against a list of table source queries and columns.
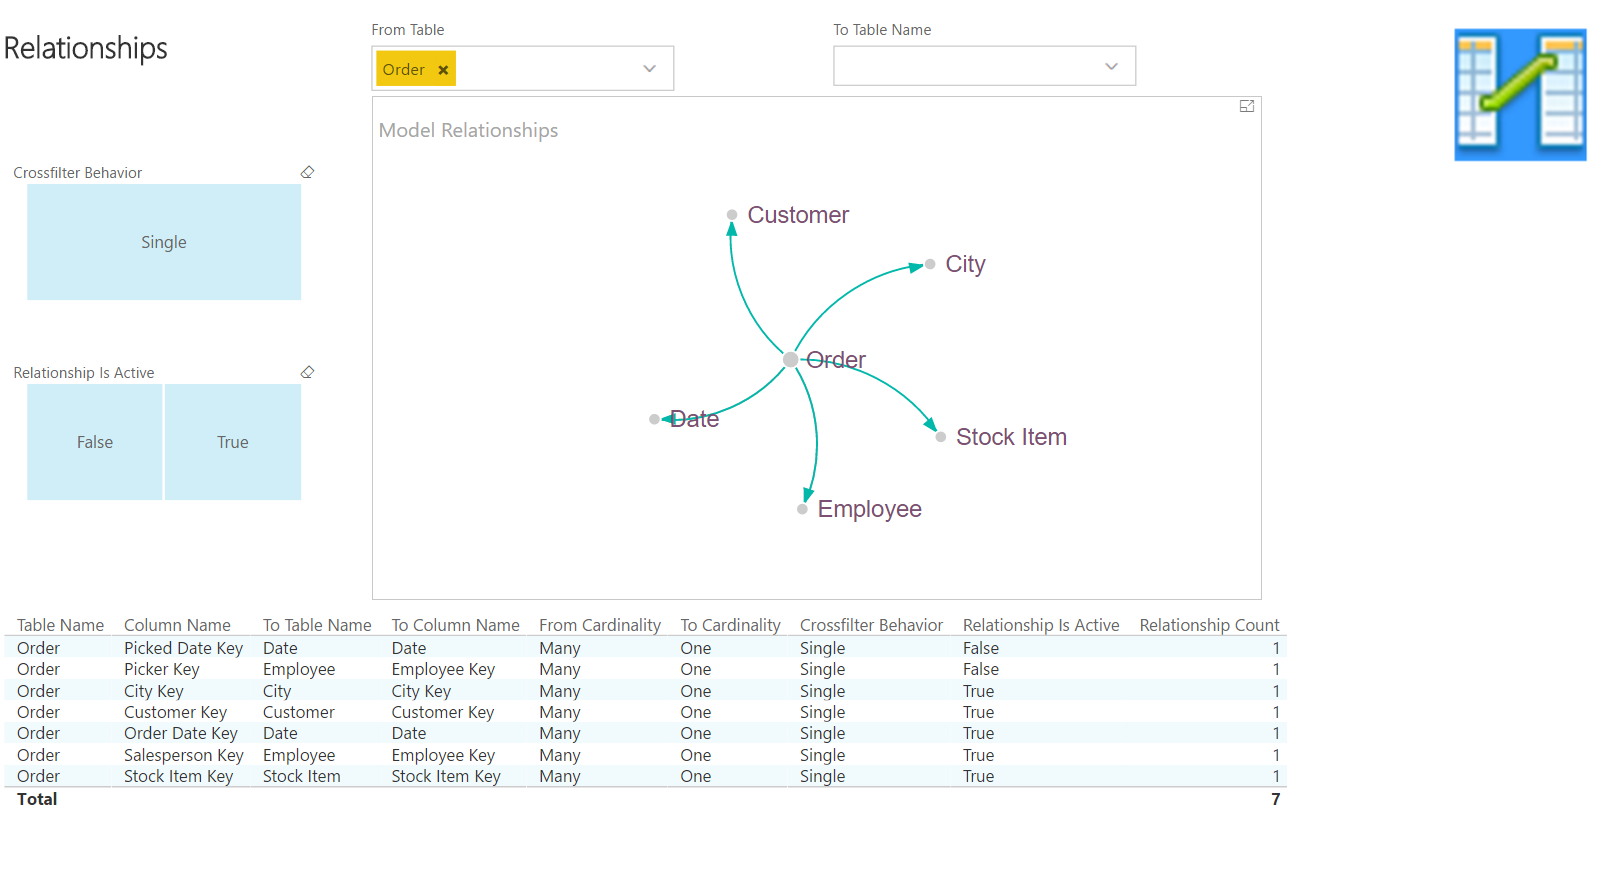
The third page shows relationships between the tables. Slicers on the left filter both the force directed graph and the table. Smart filters at the top of the page let you filter the Table and To Table in the relationships.
 The fourth page shows the details behind each measure. A column chart at the bottom provides a count of measures by table and whether the measure is hidden, which acts as another interactive filter.
The last page shows security by role and table, again using column charts as interactive filters.
You can download the Power BI model here.
Update: Check out the Demo Day video I made on the BlueGranite blog for further explanation and a demo of the Tabular Model documentation.

![]()
