

This week I was asked to create a matrix in a Power BI report that looks like this:

To my surprise, Power BI only lets you put multiple values on columns in a matrix. You can’t stack metrics vertically. Note: this is true as of 8 Jan 2016 but may change in the future. If you agree that this should be a feature in Power BI, please make your voice heard and vote for this idea on the Power BI forum and encourage others to vote for it as well.
Please vote for ‘Matrix Measures or Values on Rows instead of Columns’ in Power BI. It is much needed. https://t.co/Du2TyEb0xU
— Meagan Longoria (@mmarie) January 6, 2016
Since I needed to finish this report, I got a little creative with a disconnected table and some DAX to implement a workaround in my tabular model.
The Disconnected Table
I created a table called Row Order in my tabular model using the following SQL Query as a source.
select 1 as [Row Order], 'Lost Customers' as [Customer Metric]
union all
select 2 as [Row Order], 'Inactive Customers' as [Customer Metric]
union all
select 3 as [Row Order], 'New Customers' as [Customer Metric]
I set the Sort By Column property on the Customer Metric column to Row Order and hid the Row Order column.
Calculated Measures
I already had the base metrics for my matrix:
- Lost Customers – Week (customers considered lost in the current week, based upon the selected date)
- Lost Customers – Month (customers considered lost in the current month, based upon the selected date)
- Lost Customers – Week (customers considered lost in the current month, based upon the selected date)
- Inactive Customers – Week (customers considered to have moved to inactive status in the current week, based upon the selected date)
- Inactive Customers – Month (customers considered to have moved to inactive status in the current month, based upon the selected date)
- Inactive Customers – Quarter (customers considered to have moved to inactive status in the current quarter, based upon the selected date)
- New Customers – Week (customers who have made their first purchase in the current week, based upon the selected date)
- New Customers – Month (customers who have made their first purchase in the current month, based upon the selected date)
- New Customers – Quarter (customers who have made their first purchase in the current quarter, based upon the selected date)
As a side note, when creating time-based measures I prefer to create the measure such that it accepts a date and then filters off of that rather than assuming everyone wants to see the current week/month/quarter. I then add an Is Today field on my date table so if someone does want to see the current week they easily select that in a filter on this field. This means that I can see lost customers for any week, not just the current. Maybe I want to filter my dashboard to the end of December. If I had just created a measure that assumed I wanted last month, I wouldn’t be able to just change my date filter and get the data I want. As another example, lots of people create a metric to calculate sales in the last 6 weeks. But many people assume they want the last 6 weeks from today rather than allowing the user to choose a date and then calculating sales in the 6 weeks leading up to that day. I much prefer the more flexible calculation.
But having this flexibility in my calculations meant that I couldn’t just put some calculated column for time period in my date dimension. And even if I had made the assumption that I wanted to see the data as of today, it would probably be a separate table or a many-to-many relationship (e.g., 5 Jan 2016 would be in the last week, month, and year).
With my new disconnected table added, I just needed to add a few more measures. First, I needed something to check which customer metric I should be showing:
RowOrder:=Max('Row Order'[Row Order])
I hid the RowOrder measure. Then I created one measure for each time frame (week/month/quarter) that would select the correct measure based upon the Customer Metric on that row.
Weekly Customer:=IF(HASONEVALUE(Row Order[Row Order]), SWITCH([RowOrder],1,[Lost Customers - Week], 2,[Inactive Customers - Week], 3,[New Customers - Week],BLANK()), BLANK())
Monthly Customers:=IF(HASONEVALUE(Row Order[Row Order]), SWITCH([RowOrder],1,[Lost Customers - Month], 2,[Inactive Customers - Month], 3,[New Customers - Month],BLANK()), BLANK())
Quarterly Customers:=IF(HASONEVALUE(Row Order[Row Order]), SWITCH([RowOrder],1,[Lost Customers - Quarter], 2,[Inactive Customers - Quarter], 3,[New Customers - Quarter],BLANK()), BLANK())
Power BI Matrix
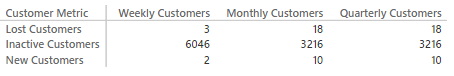
I opened my report on Power BI.com and created my matrix.
I put Customer Metric in Rows and Weekly Customers, Monthly Customers, and Quarter Customers in Values. Then I filtered my table to As of Today = “As Of Today”.

That gives me the matrix I wanted to create. I don’t love that I had to add the extra table, but it works for now until I can achieve this natively with Power BI.

![]()
