

In a heat map cells are coloured proportional to the values they contain (as shown here):

One approach to solving this, using custom assemblies and variables, is set out below. I've also created a couple of tutorials that contain detail on the main techniques used:
- Tutorial on custom assemblies in SSRS
- Tutorial on Reporting Services variables
However, I've tried to make this article self-contained, and anyone with a reasonable knowledge of Reporting Services should be able to read it as a standalone article.
Contents of Article
There's a lot to cover, so I've divided everything into 5 sections:
- Creating the basic report.
- Creating a class to contain methods/functions.
- Calculating (and storing) the lower and upper bounds.
- Setting the cell background colours.
- Building and referencing the DLL.
Let's begin with creating a basic report with which to work.
Step 1 - Creating the Basic Report
I'm assuming anyone reading this is familiar with Reporting Services, so here are the outline steps to doing this:
- Run the script attached to this file to generate a sample table called tblActors, containing 100 actors with their gender and decade of birth.
- Create a report based on this table to show a simple matrix.
This should leave you with something like this:

After a bit of tidying up and formatting, you should have a basic matrix, such as that shown below:

What we need to do is to set the background colour of each cell to be an expression - but there's a way to go before we can do that.
Step 2 - Creating a Class Library
The next thing we need is somewhere to write C# or VB functions (the ones we'll reference from within our report). The steps below show how to do this for C#; the VB procedure is virtually identical. I've included separate code for each language where relevant.
The first thing to do is to add an additional project to your solution in Visual Studio (you are using that, aren't you?).

Life is easier with custom assemblies if you keep both your projects (the one containing your reports and the one containing your C# or VB code) in the same solution.
Choose to create a class library:

Here we've called the class library project HeatMapCodeC, and chosen to use C# as our programming language. You can now add a class to this project, by right-clicking on it:

Here we choose to call this new class clsCode:

Note that you could have used the default class Class1 instead, but I've always hated using default files provided for me by Microsoft.
Now that you have a class created, we can use it to type in methods. We'll have to build these into a DLL (and reference this from our report), but that can come later in this article.
Note for C# techies: we'll make all of the methods in our class static, to avoid having to create a named instance of the class to refer to its methods. We also need to make the class public:

Note for VB techies:we'll make all of the functions in our class Shared for the same reason.
Step 3 - Storing the Upper and Lower Bounds
We need to colour matrix cells proportional to the minimum and maximum values possible. These are:
- 0 (the minimum, for several cells)
- 26 (the maximum, for males born in the 1950s)
However, we can't hard-code this data; instead, we need to calculate it. To do this I've chosen to create for simplicty a second dataset:

We'll call this dataset dsBounds:

We now need to find a way to refer to the minimum and maximum values of the Num column in this dataset (these will provide the upper and lower bounds for our heat map). The easiest way to do this is to create two variables (the advantage of this approach is that the value of a variable is only calculated once, when you first run a report). To create a variable, right-click on the edge of your report and choose to show the report properties:

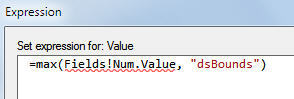
Now add in two variables (the expressions to use are shown below):

The expression for the UpperBound variable is as follows (for the LowerBound variable, just use Min instead of Max):
We now have two variables, containing (we know) the upper and lower bounds for the heat map. We need to find some way to store these in our code. The solution is to create two private variables, which we'll call MinActors and MaxActors, and set these using a method or function. First create the variables and the function. Here's what the code will look like in C#:
public class clsCode
{
// variables to hold bounds
private static int MinActors = 0;
private static int MaxActors = 0;
// this method initailises bounds
public static int SetCounts(
int MinCount,
int MaxCount)
{
// store the thresholds set
MinActors = MinCount;
MaxActors = MaxCount;
return 0;
}
}
Here's the Visual Basic equivalent:
'private variables to hold bounds
Private Shared MinActors As Integer = 0
Private Shared MaxActors As Integer = 0
Shared Function SetCounts(
MinCount As Integer,
MaxCount As Integer) As Integer
'store the upper/lower bounds
MinActors = MinCount
MaxActors = MaxCount
Return 0
End Function
All that we now need to do is to make sure that the SetCounts function is called when we run the report. To do this, create a textbox at the top of your report and make it have a white font and white background (if you make it invisbile it doesn't seem to run). The textbox value should be as follows:

Note that you can use the Variables category shown to insert the variable values (you don't have to type them in).
Don't try to run your report yet, because we haven't yet built the clsCode class, let alone referenced it in the report - that will come soon.
Step 4 - Calculating the Background Colours
Now that we know the lowest and highest possible number for each cell, all that we need to do is to calculate a colour. For example, if there are 13 male actors in a particular decade, then we should return a colour midway between the lightest and darkest, since 13 is halfway between 0 (the minimum) and 26 (the maximum).
To calculate the colour, we'll create a method in C# or function in VB called Colour (sorry - I'm from the UK!). This will take in a number between the lower and upper bound, and spit out a hexadecimal colour code. I've chosen to vary the greenness of my cells only.
Here's the C# method:
public static string Colour(int ThisValue) {
// work out how much to colour this cell
int numerator = ThisValue - MinActors;
int denominator = MaxActors - MinActors;
decimal Proportion = (decimal)numerator / (decimal)denominator;
// translate this into a number from 0 to 255
int p = (int) (255 * Proportion);
int GreenValue = 255 - p;
// turn this into a hexadecimal colour code
string HexCode = GreenValue.ToString("x");
if (HexCode.Length ==1) {
HexCode = "0" + HexCode; }
return "#FF" + HexCode + "FF";
}
The equivalent in VB is:
Shared Function Colour(ThisValue As Integer) As String
'work out how much to colour this cell
Dim Proportion As Decimal = (ThisValue - MinActors) / (MaxActors - MinActors)
'translate this into a number from 0 to 255
Dim GreenValue As Byte = 255 - Math.Floor(255 * Proportion)
'turn this into a hexadecimal colour code
Return "#FF" & Right("0" & Hex(GreenValue), 2) & "FF"
End Function
Both functions work out what proportion of 255 this number represents, and turn this into the hexadecimal equivalent.
Having created the functions above, we just need to refer to them in the background colour of our matrix cells. First select the matrix cells:

Now set their background colour property to be an expression:

Create an expression to call the Colour function:

All that now remains is to build your function, copy the DLL to the right place and then reference it in your report.
Step 5 - Building and Referencing the DLL
We now need to make the C# or VB functions accessible to the report, so that the heat map works. Start by building the C# or VB project:

If you have no errors in your code, you should see the message Build Succeeded in the bottom left corner of your screen. This means that Visual Studio ahs created a dynamic link library file containing the compiled code: called HeatMapCodeC.DLL. The problem now is that it's in the wrong place!
- The DLL file is in your Visual Studio project;
- You need a copy of the DLL file in your development report server project (the one you use for creating reports); and
- You need a copy of the file in your live version (the one people see when they view reports through Report Manager).
The 3 folders in question will depend on which version of SSRS you're running and whether you have any named instances of SQL Server, but if I tell you the folder names on my laptop it should help you find them. They are:
- C:\ajb files\HeatMapCodeC\bin\Debug is the folder containing the project's compiled code. This is what I need to copy.
- C:\Program Files\Microsoft Visual Studio 10.0\Common7\IDE\PrivateAssemblies is the folder Visual Studio will look for when you preview a report on my laptop.
- C:\Program Files\Microsoft SQL Server\MSRS10_50.SQL2008R2\Reporting Services\ReportServer\bin is the name of the folder Report Manager will look in.
Bear in mind that I have a named instance of SQL Server called SQL2008R2 which I'm using, and that for most companies the Report Manager (live) server will be on a different computer altogether.
So on my computer, you'd copy the following file to the development and (if required at this stage) live server:

If you get sick of copying DLL files over whenever you rebuild a code project (and you will), you might like to consider creating post-build events to do this automatically for you.
You should now be ready to reference your code project within any report using it. To do this, go to your report's properties (if you're not show how to do this, see earlier in this blog), then add a reference:

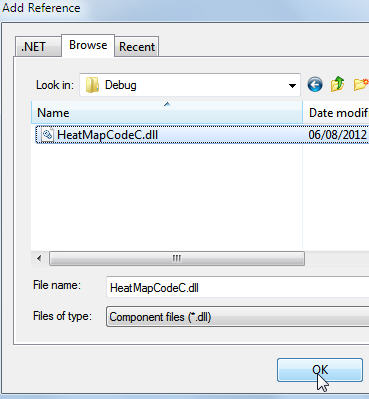
Click on the build button to add a reference to your code project:

Choose your DLL file (note that - oddly - it doesn't matter at this stage which version of the file you choose: the one in your code project will do fine):
If all goes well, you can now view your report!

