
In the previous level of this stairway, I showed you a custom SSIS package and SQL Agent jobs to automate management of SQL Traces among multiple servers. In this level, I’ll use the Data Collector feature of SQL Server to achieve similar functionality.
Data Collector Overview
Introduced in SQL Server 2008, the Data Collector provides a flexible way to collect performance-related data from multiple servers and upload the collected data into a central database repository, known as the Management Data Warehouse (MDW). The Data Collector uses Integration Services packages and SQL Server Agent jobs internally to accomplish these tasks. Included with the Data Collector are system data collection Sets and reports that are useful in performance analysis and troubleshooting.
A lesser known feature of the Data Collector is the Generic SQL Trace Collector Type, which allows you create custom SQL Trace data collection sets that regularly collect and upload server-side SQL Trace data into the MDW similarly to the custom database, package and jobs covered in the previous levels of this Stairway.
In this level, I’ll assume you are already familiar with the Data Collector but new to SQL Trace data collection sets. I’ll briefly review creating the MDW and Data Collector configuration but the focus of this Level is on SQL Trace data collection rather than the Data Collector in general. For more information on Data Collector architecture and configuration, I suggest Kalen Delaney’s whitepaper, SQL Server 2008 Management Data Warehouse. There is also a good deal of information in the SQL Server Books Online Data Collection topic.
Preparing for Data Collection
The Management Data Warehouse (MDW) database must be created before you can configure data collection because the MDW database is the central repository for collected data. One typically creates an instance of this database on a shared server (named CENTRAL here), which is used as the target of all data collected in a multi-instance environment. I won’t discuss all the details of creating the MDW database and configuring data collection since that’s covered pretty well in the whitepaper I mentioned earlier as well as in the SQL Server Books Online. However, I’ll briefly review these tasks here since they are required before a SQL Trace data collection set can be created.
The MDW is easily created using the Wizard in SQL Server Management Studio (SSMS). The Wizard is launched from SSMS Object Explorer connected to your central server. Right-click Data Collection under the Management node and select Configure Management Data Warehouse. Select the “create or upgrade management data warehouse” option and complete the Wizard. The Wizard also provides the option to map logins to the msdb mdw_admin, mdw_reader and mdw_reader writer roles. These roles are only needed for non-sysadmin role members to administer and/or use the Data Collector.
The Data Collector on each instance is also configured using the same Wizard, this time selecting the second task to “set up data collection”. For each instance you want to collect SQL Trace data from, connect to the instance using SSMS Object Explorer and launch the “Configure Management Data Warehouse” Wizard again. This time, select “Setup data collection” and click Next. Specify the central MDW server and database along with a local cache directly for the temporary files. Figure 1 shows an example of this Wizard dialog. Click Next and complete the Wizard to start data collection.
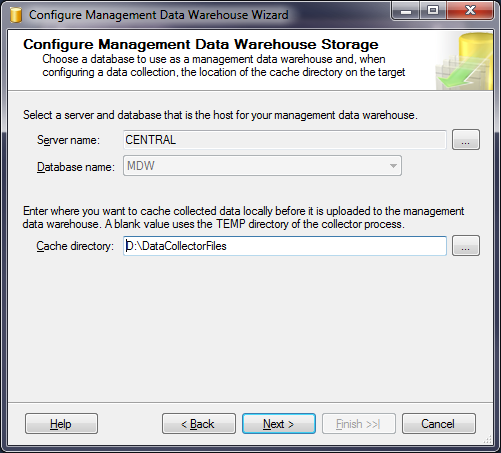
Figure 1: Setup data collection wizard dialog
Creating a SQL Trace Data Collection Set
After the Data Collector is configured on each instance, only the System Data Collection Sets exist which you can now observe under the Data Collection Node. You can add your own collection sets using T-SQL, including a custom SQL Trace data collection set. The easiest way to create a SQL Trace data collection set is with Profiler, much in the same way a Profiler trace can be scripted for server-side tracing. Profiler trace scripting was discussed in Level 3 of this Stairway.
For this walkthrough, use Profiler to create a trace of RPC:Completed and SQL:BatchCompleted events with a Duration filter of 10 seconds or more (10,000 milliseconds or 10,000,000 microseconds) as shown in figures 2 and 3. This is the same trace created in the previously in this Stairway and is useful for OLTP systems where queries should seldom exceed a given threshold. Run the trace briefly against a test server to verify it captures events as expected and then stop the trace.
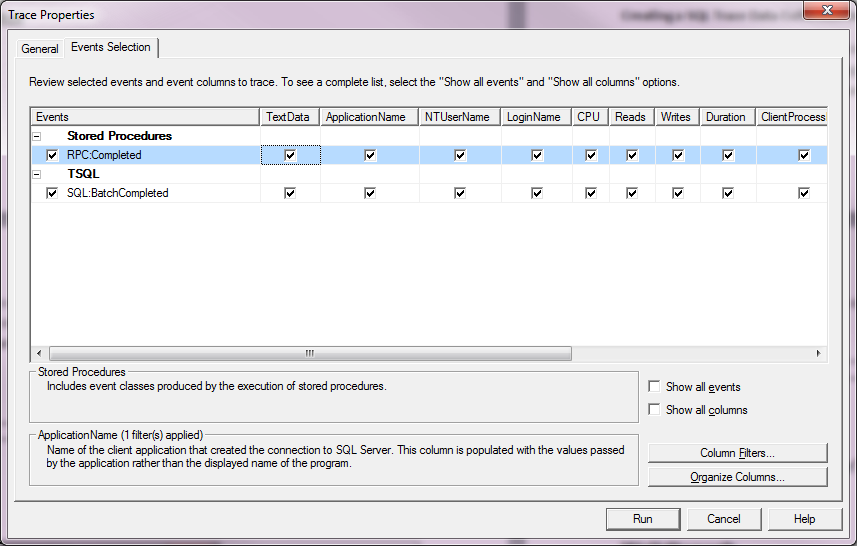
Figure 2: Profiler event selection of RPC:Completed and Batch:Completed events
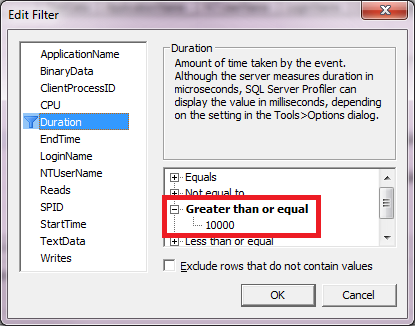
Figure 3: Profiler filter on duration
Once the trace is stopped, export the definition as a SQL Trace Collection Set script. This is done from the Profiler File menu by clicking FileàExportàScript Trace DefinitionàFor SQL Trace Collection Set. Specify the desired file name and location and click the Save button to save the script file. I recommend also saving the trace as a Trace Template (FileàSave As). This way, all of the trace events, columns and filters are saved, allowing to you easily modify the trace and script the trace definition again as needed.
Open the saved script file in an SSMS query window, connecting to an instance you want to continuously run this trace on. The default names in the script may be customized as indicated in the Profiler-generated comments. Change the @name parameter of the sp_syscollector_create_collection_set execute statement from “SqlTrace Collection Set Name” to a descriptive name like “SqlTrace Collection Set”. This is the name that will show under the ManagementàData Collection node in SSMS Object Explorer after the SQL Trace data collector set is created. Also, change the @name parameter of sp_syscollector_create_collection_item to identify the specific trace like “Long-Running Queries”. This name will show under the collection items of the data collection set properties. Other properties can be configured using the SSMS GUI after the collection set is created, which I’ll discuss shortly. Run the script to create the SQL Trace data collection set.
USE msdb
GO
BEGIN TRANSACTION
BEGIN TRY
-- Define collection set
-- ***
-- *** Replace 'SqlTrace Collection Set Name Here' in the following script
-- *** with the name you want to use for the collection set.
-- ***
DECLARE @collection_set_id int;
EXEC [dbo].[sp_syscollector_create_collection_set]
    @name = N'SqlTrace Collection Set',
    @schedule_name = N'CollectorSchedule_Every_15min',
    @collection_mode = 0, -- cached mode needed for Trace collections
    @logging_level = 0, -- minimum logging
    @days_until_expiration = 5,
    @description = N'Collection set generated by SQL Server Profiler',
    @collection_set_id = @collection_set_id output;
SELECT @collection_set_id;
-- Define input and output varaibles for the collection item
DECLARE @trace_definition xml;
DECLARE @collection_item_id int;
-- Define the trace parameters as an XML variable
SELECT @trace_definition = convert(xml,
N'<ns:SqlTraceCollector xmlns:ns="DataCollectorType" use_default="0">
<Events>
  <EventType name="Stored Procedures">
    <Event id="10" name="RPC:Completed"
columnslist="1,9,2,10,6,11,12,13,14,15,16,17,18" />
  </EventType>
  <EventType name="TSQL">
    <Event id="12" name="SQL:BatchCompleted"
columnslist="1,9,11,6,10,12,13,14,15,16,17,18" />
  </EventType>
</Events>
<Filters>
  <Filter columnid="13" columnname="Duration" logical_operator="AND"
comparison_operator="GE" value="1000000L" />
</Filters>
</ns:SqlTraceCollector>');
-- Retrieve the collector type GUID for the trace collector type
DECLARE @collector_type_GUID uniqueidentifier;
SELECT @collector_type_GUID = collector_type_uid FROM [dbo].[syscollector_collector_types] WHERE name = N'Generic SQL Trace Collector Type';
-- Create the trace collection item
-- ***
-- *** Replace 'SqlTrace Collection Item Name Here' in the following script
-- *** with the name you want to use for the collection item.
-- ***
EXEC [dbo].[sp_syscollector_create_collection_item]
   @collection_set_id = @collection_set_id,
   @collector_type_uid = @collector_type_GUID,
   @name = N'Long-Running Queries',
   @frequency = 900, -- specified the frequency for checking to see if trace is still running
   @parameters = @trace_definition,
   @collection_item_id = @collection_item_id output;
SELECT @collection_item_id;
COMMIT TRANSACTION;
END TRY
BEGIN CATCH
ROLLBACK TRANSACTION;
DECLARE @ErrorMessage nvarchar(4000);
DECLARE @ErrorSeverity int;
DECLARE @ErrorState int;
DECLARE @ErrorNumber int;
DECLARE @ErrorLine int;
DECLARE @ErrorProcedure nvarchar(200);
SELECT @ErrorLine = ERROR_LINE(),
       @ErrorSeverity = ERROR_SEVERITY(),
       @ErrorState = ERROR_STATE(),
       @ErrorNumber = ERROR_NUMBER(),
       @ErrorMessage = ERROR_MESSAGE(),
       @ErrorProcedure = ISNULL(ERROR_PROCEDURE(), '-');
RAISERROR (14684, @ErrorSeverity, 1 , @ErrorNumber, @ErrorSeverity, @ErrorState, @ErrorProcedure, @ErrorLine, @ErrorMessage);
END CATCH;
GO
Listing 1: Script to create SqlTrace Collection Set
Now that the SQL Trace data collection set has been created, open an SSMS Object Explorer window connection to this server or, if you already have one open, refresh the ManagementàData Collection node. Expand the Data Collection node and you will see the newly created collection as figure 4 shows.
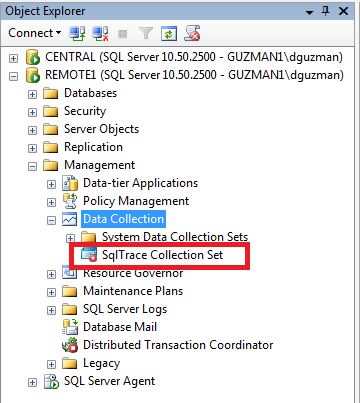
Figure 4: Newly created SqlTrace Collection Set in SSMS Object Explorer
The red circle icon on the SqlTrace Collector Set indicates that the collector set is stopped and not currently collecting data. Double click on the node to show the properties dialog in figure 5.
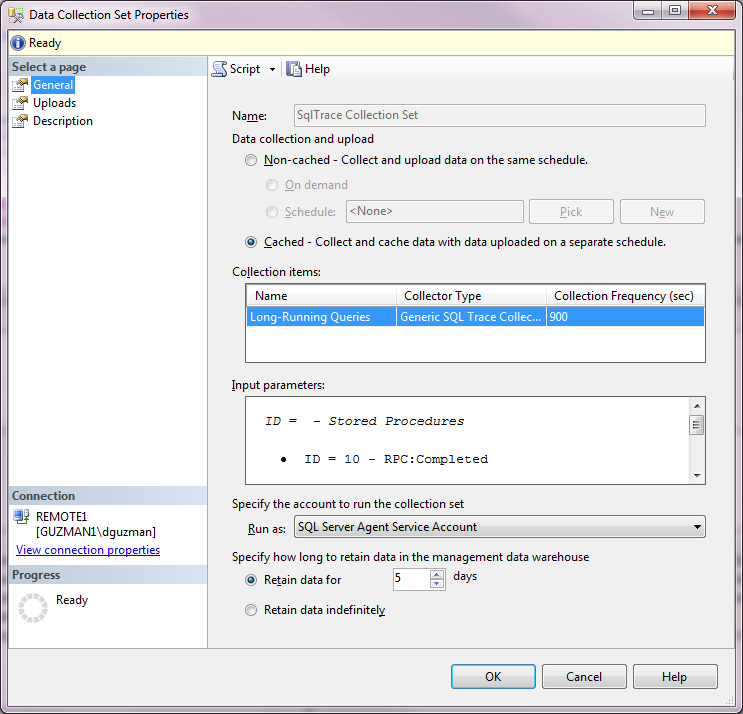
Figure 5: Properties of SQL Trace Collection Set
Note the Cached radio button is selected. SQL Trace data must be cached, meaning that the SQL Trace file is written to the configured Data Collection cache directory and separately uploaded to the MDW by a scheduled job managed by the Data Collector. The Data Collector manages these jobs, steps and schedules so any actions or modifications should normally be done via the Data Collector rather than directly to the SQL Agent objects.
Under Collection items, the Long Running Query trace item is displayed, showing the type (Generic SQL Trace Collector) and the Collection Frequency (900 seconds). For a Generic SQL Trace Collector, the Collection Frequency specifies how often the Data Collector checks to ensure the trace is running and (re)starts it as needed. This value can be modified by clicking on the value but I haven’t personally found a reason to change the default value of 900 seconds (15 minutes).
The Input parameters show the events collected by the trace along with the trace filter(s), which may require scrolling down in the Input parameters box. This allows you to see what events are being captured by the collector at a glance.
A nice feature of the Data Collector is the retention options at the bottom of the property window. Specify the number of days you would like to retain the collected trace data or specify indefinitely. For this long-running query trace, the 5 day retention is adequate because this data is typically reviewed by a DBA daily or used as forensics shortly after a problem is reported. The retention can be modified via the GUI as desired.
Click Uploads on the left page navigation pane to show the schedule at which collected data is uploaded to the MDW. The default is every 15 minutes but can be easily changed by either selecting an existing schedule (Pick button) or creating a new schedule (New button). The schedule dialog is the same one that SQL Server Agent uses because the Data Collector uses SQL Server agent as the scheduling engine for both data collection and periodic uploads.
SQL Trace data can also be uploaded to the MDW on demand by right-clicking on the SqlTrace Collector Set in the SSMS Object Exporter and selecting Collect and Upload now. An on-demand upload is useful when you need current data available in the MDW and don’t want to wait for the next scheduled upload.
If you make changes through the GUI and plan to deploy the same collection set to other instances, I recommend scripting the data collection set with the changes. Right-click on the SQL Trace collection set and select Script Data Collection asàCreate To. This way, you can run the script against multiple instances without having to make the same repetitive changes on each instance using the SSMS GUI.
Right-click on the SqlTrace Collection Set in the SSMS Object Explorer and select Start Data Collection Set to start the collector. The data collector will then run the corresponding job to start and monitor the SQL Trace. Trace data will be uploaded into the MDW according to the Upload schedule (every 15 minutes).
Querying Trace Data
The Generic SQL Trace Data Collector uploads SQL Trace data to table snapshots.trace_data in the MDW database. This table is nearly identical to the universal trace data table discussed in Levels 7 and 8 of this Stairway, plus a few additional columns used by the Data Collector. This table can be queried in ad-hoc fashion as needed.
For the purpose of proactively identifying exceptionally long-running queries on an OLTP system, a good practice is to query the snapshots.trace_data table regularly. The query in Listing 2 lists the queries captured by the long-running query trace since midnight yesterday in descending sequence by duration.
SELECT TextData
FROM snapshots.trace_data
WHERE StartTime > DATEADD(day, -1, CAST(GETDATE() AS date))
ORDER BY Duration DESC;
Listing 2: Ad-hoc snapshots.trace_data query
You can ignore queries that are expected to run long, such as occasional report queries or database maintenance activity. If these are predictable, consider adding trace filters to omit those. Start with the trace template saved earlier, add the desired filters and follow the steps in the previous section to create the new SQL Trace data collection script. Delete the existing collection set (right-click on Sql Trace Collection Set and select Delete) and run the new script. Not only will additional filters eliminate unwanted noise, space requirements and processing time will be reduced.
Duplicate Trace Events
A couple of situations exist that may result in duplicate events being uploaded into the snapshots.trace_data table. One is if you run multiple SQL Trace data collector sets on a server and collect the same SQL Trace event type in each. Unless the trace filters are mutually exclusive, each trace may capture the same event, resulting in multiple rows in the snapshots.trace_data table that differ only by the trace_info_id and snapshot_id column values. Be aware of this as you query the table. If you run multiple collectors and are interested in events for only a specific trace, include a WHERE clause in queries that corresponds to all of the source trace filter(s).
Another cause of duplicate events is a bug in the Generic SQL Trace Data Collector. Duplicate trace records may be uploaded into the snapshots.trace_data table because the upload doesn’t always record the last trace event sequence number properly. This bug has been reported on the Microsoft Connect site along with a simple workaround. Until Microsoft releases a fix, you can avoid the issue by changing the update statement in MDW database stored procedure snapshots.sp_trace_update_info. Listing 3 contains the necessary ALTER PROCEDURE script to run against your MDW database.
ALTER PROCEDURE [snapshots].[sp_trace_update_info]
    @trace_info_id       int,
    @snapshot_id         int,
    @last_event_sequence bigint,
    @is_running          bit,
    @event_count         bigint,
    @dropped_event_count int
AS
BEGIN
    SET NOCOUNT ON;
    -- Security check (role membership)
    IF (NOT (ISNULL(IS_MEMBER(N'mdw_writer'), 0) = 1) AND NOT (ISNULL(IS_SRVROLEMEMBER(N'sysadmin'), 0) = 1))
    BEGIN
        RAISERROR(14677, 16, -1, 'mdw_writer');
        RETURN(1); -- Failure
    END;
    -- Parameters check - mandatory parameters
    IF (@trace_info_id IS NULL)
    BEGIN
        RAISERROR(14200, -1, -1, '@trace_info_id')
        RETURN(1) -- Failure
    END;
    IF NOT EXISTS (SELECT trace_info_id from snapshots.trace_info where trace_info_id = @trace_info_id)
    BEGIN
        DECLARE @trace_info_id_as_char NVARCHAR(10)
        SELECT @trace_info_id_as_char = CONVERT(NVARCHAR(36), @trace_info_id)
        RAISERROR(14679, -1, -1, N'@trace_info_id', @trace_info_id_as_char)
        RETURN(1) -- Failure
    END;
    IF (@snapshot_id IS NULL)
    BEGIN
        RAISERROR(14200, -1, -1, '@snapshot_id')
        RETURN(1) -- Failure
    END;
    IF NOT EXISTS (SELECT snapshot_id from core.snapshots where snapshot_id = @snapshot_id)
    BEGIN
        DECLARE @snapshot_id_as_char NVARCHAR(36)
        SELECT @snapshot_id_as_char = CONVERT(NVARCHAR(36), @snapshot_id)
        RAISERROR(14679, -1, -1, N'@snapshot_id', @snapshot_id_as_char)
        RETURN(1) -- Failure
    END;
    IF (@last_event_sequence IS NULL)
    BEGIN
        RAISERROR(14200, -1, -1, '@last_event_sequence')
        RETURN(1) -- Failure
    END;
    IF (@is_running IS NULL)
    BEGIN
        RAISERROR(14200, -1, -1, '@is_running')
        RETURN(1) -- Failure
    END;
    IF (@event_count IS NULL)
    BEGIN
        RAISERROR(14200, -1, -1, '@event_count')
        RETURN(1) -- Failure
    END;
    IF (@dropped_event_count IS NULL)
    BEGIN
        RAISERROR(14200, -1, -1, '@dropped_event_count')
        RETURN(1) -- Failure
    END;
    -- Update existing record
    --UPDATE [snapshots].[trace_info]
    --SET
    --    last_snapshot_id = @snapshot_id,
    --    last_event_sequence = @last_event_sequence,
    --    is_running = @is_running,
    --    event_count = ISNULL(event_count,0) + @event_count,
    --    dropped_event_count = @dropped_event_count
    --WHERE
    --    trace_info_id = @trace_info_id;

    --BUG FIX: -- retain last_event_sequence when no events are uploaded
UPDATE [snapshots].[trace_info]
    SET
        last_snapshot_id = @snapshot_id,
        last_event_sequence = case when @event_count = 0 then last_event_sequence else @last_event_sequence end,
        is_running = @is_running,
        event_count = ISNULL(event_count,0) + @event_count,
        dropped_event_count = @dropped_event_count
    WHERE
        trace_info_id = @trace_info_id;
    RETURN(0);
END
GO
Listing 3: Workaround to prevent duplicate SQL Trace events during upload
Summary
The Data Collector feature provides an easy way to collect SQL Trace data from multiple instances. The collected data can be used for a variety of purposes, included daily run books or forensics. Centralized data collection to the MDW provides a holistic view SQL Trace activity among multiple servers, which is especially useful with distributed applications. Although not discussed in detail in this article, the Data Collector provides additional value with System Data Collection Sets that can be queried and correlated with SQL Trace data.
In the final article of this Stairway, I’ll compare and contrast Profiler and server-side SQL tracing performance, as well as review some important gotchas.
