I mentioned in the first level of this Stairway that server-side traces incur much less overhead than client-side Profiler traces. This topic will show you how to a create server-side trace using TSQL to minimize overhead. Before I dive into those details, I want to quantify the performance differential of Profiler client-side tracing versus server-side tracing in high-volume tracing scenarios.
In his Performance Impact: Profiler Tracing vs. Server Side SQL Tracing blog post, SQL Server MVP Linchi Shea demonstrated that the performance overhead of a Profiler trace was nearly 50% using a TPC-like benchmarking tool with a 300 user simulated load. In contrast, he observed almost no discernable impact with a server-side trace. I can attest to the fact that the overhead of server-side traces is negligible in all but the most extreme situations so I strongly advocate using server-side tracing instead of Profiler for most production tracing scenarios.
Server-Side Trace T-SQL Script
I must admit that I seldom create a server-side trace script from scratch because it’s such a tedious task to look up the event and column IDs needed for the trace create script. Events and data columns must be specified by a number and you need one call to the stored procedure sp_trace_setevent for EACH combination of event and data you want to include in the trace. So if you had only 4 events and 5 data columns, you would need 20 sp_trace_setevent calls, each with the event and column ID you want to collect. Fortunately, Profiler makes this work easier by providing the ability to export a client-side trace that was created and run with the Profiler GUI to a script that can be customized for server-side tracing. I’ll cover server-side trace definition scripting using Profiler in detail in the next level.
That said, it’s essential to have a solid understanding of SQL Trace stored procedures, catalog views, and functions. This knowledge allows one to tweak server-side traces beyond the Profiler’s capabilities and report on existing traces inside the database engine, which is functionality that is not available in Profiler or the SQL Server Management Studio Object Explorer. I will walkthrough a sample server-side trace script to show how traces are defined and discuss SQL Trace stored procedure parameters in detail.
Server-side traces are defined with a T-SQL script that executes a few stored procedures. In fact, these are the same stored procedures that Profiler runs under the covers to create a client-side trace. The only difference is that the server-side trace destination specifies a file instead of returning results back to Profiler or your custom SMO trace application. The steps to needed to create a server-side trace are:
- Create a trace using sp_trace_create
- Add events and columns using sp_trace_setevent
- Optionally, add column filters using sp_trace_setfilter
I created a sample server-side trace script to illustrate these steps. I suggest you run this script on a test server after you’ve read this article in order to become comfortable with server-side tracing and trace files.
The sample script in listing 1 defines a trace of batch and RPC completed events that run 10 seconds or longer. Continuously running a long-running query trace like this allows a DBA to proactively identify performance improvement opportunities instead of waiting until users complain of slow response times and timeouts. I used an arbitrary 10-second duration filter here for illustration and included only TextData, Duration and EndTime columns for brevity. The filter threshold one might use in a production trace needs to be customized for the workload at hand (I use a low 100 milliseconds filter value on a tuned OLTP-only server) and additional columns like Reads and CPU would typically be included.
DECLARE @return_code INT;
DECLARE @TraceID INT;
DECLARE @maxfilesize BIGINT;
SET @maxfilesize = 5;
--step 1: create a new empty trace definition
EXEC sp_trace_create
                @traceid OUTPUT
               , @options = 2
               , @tracefile = N'C:\TraceFiles\LongRunningQueries'
               , @maxfilesize = @maxfilesize
    , @stoptime =NULL
    , @filecount = 2;
-- step 2: add the events and columns
EXEC sp_trace_setevent
                @traceid = @TraceID
               , @eventid = 10 -- RPC:Completed
               , @columnid = 1 -- TextData
               , @on = 1;--include this column in trace
EXEC sp_trace_setevent
                @traceid = @TraceID
               , @eventid = 10 -- RPC:Completed
               , @columnid = 13 --Duration
               , @on = 1;--include this column in trace
EXEC sp_trace_setevent
                @traceid = @TraceID
               , @eventid = 10 -- RPC:Completed
               , @columnid = 15 --EndTime
               , @on = 1;--include this column in trace
EXEC sp_trace_setevent
                @traceid = @TraceID
               , @eventid = 12 -- SQL:BatchCompleted
               , @columnid = 1 -- TextData
               , @on = 1;--include this column in trace
EXEC sp_trace_setevent
                @traceid = @TraceID
               , @eventid = 12 -- SQL:BatchCompleted
               , @columnid = 13 --Duration
               , @on = 1;--include this column in trace
EXEC sp_trace_setevent
                @traceid = @TraceID
               , @eventid = 12 -- SQL:BatchCompleted
               , @columnid = 15 --EndTime
               , @on = 1;--include this column in trace
-- step 3: add duration filter
DECLARE @DurationFilter BIGINT;
SET @DurationFilter = 10000000; --duration in microseconds
EXEC sp_trace_setfilter
                @traceid = @TraceID
               , @columnid = 13
               , @logical_operator = 0 --AND
               , @comparison_operator = 4 -- greater than or equal to
               , @value = @DurationFilter; --filter value
SELECT @TraceID AS TraceID;
Listing 1: Trace definition create script
Trace definitions are not persisted across SQL Server restarts. In order to run a trace continuously whenever SQL Server is running, it is necessary to recreate the trace when SQL Server is started using either a T-SQL script or a stored procedure that encapsulates the script. This can be accomplished by including the trace create script or stored procedure execute statement in a SQL Agent job T-SQL step that is scheduled to run whenever then SQL Agent service starts. Another method is to create a stored procedure in the master database that runs automatically upon instance startup (by marking the procedure as startup with sp_procoption).
Below are the three basic steps used to create the trace script shown in Listing 1.
Step 1: Create trace
The first step in server-side tracing is to execute sp_trace_create as shown in lines 5-11 of the listing 1 script. This stored procedure creates a new trace, initially in the stopped state, with the specified trace file and attributes. The trace file is physically created when sp_trace_create is run but no tracing occurs until the trace is later started. SQL Server assigns a trace id value to the new trace and returns the value via the @traceid output parameter. The assigned trace id value uniquely identifies this trace and is used in subsequent sp_trace_* procs to add events, columns and filters. The trace id is also needed to manage the trace (start, stop and delete) so the script displays the id of the new trace using the SELECT statement on line 50.
The required @tracefile parameter specifies the full trace file path with no extension. SQL Server appends file extension “.trc” to the file name and, in the case of rollover files, add an incremental file number to the file name as new files are generated. I will discuss more about rollover files and other options shortly. The first trace file created by this example will be named “C:\TraceFiles\LongRunningQueries.trc”. It’s a good idea to create a folder dedicated to trace files on a drive that is not shared with user database files in order to facilitate trace file management and performance. The “C:\TraceFiles” folder I use in this example must exist before the trace is created. Also, avoid using a file name that ends with an underscore followed by a number as to prevent collisions with rollover file names.
SQL Trace provides three trace options, TRACE_FILE_ROLLOVER, SHUTDOWN_ON_ERRORand TRACE_PRODUCE_BLACKBOXwhich have option values 2, 4 and 8 respectively. Option value zero specifies that none of these options are desired, resulting in a single trace file. The rollover and shutdown options may be combined by summing those option values (value 6). The blackbox trace option, which I’ll discuss in detail in a subsequent level, cannot be combined with other options. SHUTDOWN_ON_ERROR will cause SQL Server to shut itself down if data cannot be written to the trace file for any reason. The shutdown option is typically used only when gathering mandatory audit information, such as for regulatory compliance.
I’ve specified only the rollover option in this example. SQL Trace will write trace data until the @maxfilesize value (in MB) is reached and create new rollover files as needed. Rollover files are named with an underscore followed by an incremental number at the end of the file name (e.g. “LongRunningQueries_1.trc.”). The number of rollover files is limited according to the @filecount specification. SQL Trace retains the number of files specified and deletes previously created trace files automatically. Disk space requirements for a given trace are the product of @maxfileSize and @filecount (10MB in this example).
The optional @stoptime parameter indicates that the trace will stop automatically when the specified date/time is reached. If @stoptime is omitted or NULL (as in this example), the trace will run continuously until the trace is stopped manually, SQL Server is shutdown or @maxfilesize is reached and rollover is not specified. The trace will also stop if an error occurs when writing to the trace file.
Step 2: Add events and columns
Trace events and columns are added to the trace using sp_trace_setevent. The query in Listing 2 reports the thousands of possible event/column combinations that can be included in a trace along with the EventID and ColumnID values needed for sp_trace_setevent. The Profiler GUI provides the same event column selection list but with results in pivoted format.
Remember that not all columns apply to a particular event. The sys.trace_event_bindings trace catalog view contains a list of possible event/column specifications. This query uses sys.trace_event_bindings to include only usable event/column combinations and joins to the sys.trace_events and sys.trace_columns views to retrieve event and column names along with the column data type that will be needed later for the filter specification.
Similar event classes are grouped together into the categories contained in the sys.trace_event_categories view. Although event category is not technically needed for tracing, listing events by category makes it easier to find specific events from the list of nearly 200 events displayed by Profiler and the Listing 2 query results. The event column query uses sys.trace_event_categories to get the event category name so that the results can be ordered alphabetically by category, event and column, thus making it easier to find the desired event data columns within the rather large list.
 --list all possible trace events and columns
 SELECT  tcat.name AS EventCategoryName ,
        tevent.name AS EventClassName ,
        tcolumn.name AS EventColumn ,
        tevent.trace_event_id AS EventID ,
        tbinding.trace_column_id AS ColumnID ,
        tcolumn.type_name AS DataType
 FROM   sys.trace_categories AS tcat
        JOIN sys.trace_eventsAS tevent
            ON tevent.category_id = tcat.category_id
        JOIN sys.trace_event_bindings AS tbinding
            ON tbinding.trace_event_id = tevent.trace_event_id
        JOIN sys.trace_columnsAS tcolumn
            ON tcolumn.trace_column_id = tbinding.trace_column_id
 ORDER BY tcat.name ,
        EventClassName ,
        EventColumn ;
Listing 2: Query all trace events and columns
From the list of possible event columns returned by the Listing 2 query, I’m including only 3 columns (Duration, TextData and EndTime) of 2 events (RPC:Completed and SQL:BatchCompleted) in this trace. Figure 1 shows the abbreviated SSMS query results with only those 6 event/column rows shown.
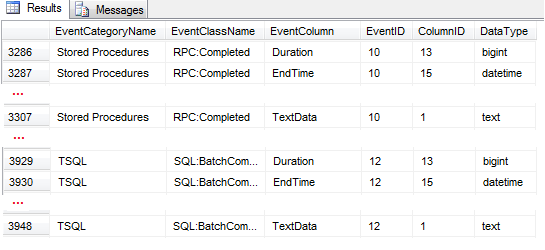
Figure 1: Included trace events and columns
As you can see in lines 12-41 of the listing.1 trace definition script, a separate call to sp_trace_setevent is needed for each of these 6 event data columns. The stored procedure parameters include @traceid (value from sp_trace_create) along with the @eventid and @columnid values from Figure 1. The @on parameter value 1 indicates the column is included in the trace, while value zero removes a previously added column from the trace. Only events with at least one data column are included in the trace, which are the RPC:Completed and SQL:BatchCompleted events in this example.
Step 3: Add filters
Trace filters are optional but should be specified whenever possible to eliminate the overhead of tracing unwanted data and avoid the need to filter trace data later. In the hypothetical OLTP workload in this example, the vast majority of queries run well under 10 seconds and I’m interested only in capturing the exceptionally long-running outliers. I specified a Duration filter of 10 seconds or greater so that only relevant events are included while avoiding the noise of the many normal queries in the collected data. In addition to maximizing tracing performance by collecting only pertinent data, the filter minimizes trace file space requirements.
Trace filters behave much like a WHERE clause in a SQL query; each filter specifies a trace column, comparison operator and value. Only trace records that satisfy the specified condition(s) are written to the trace file. Multiple filters may be specified, which are combined with the previously added filter using AND/OR logical operators. When multiple filters on the same column are specified, these must be added consecutively without interleaving filters on other columns.
For example, to include only queries that run between 10 and 30 seconds, one would add 2 consecutive filters on the Duration column. The first would specify Duration greater than or equal to 10 seconds and the second would specify the AND logical operator along with Duration less than or equal to 30 seconds. Filters on other columns can similarly be added to create more complex filters. So to trace queries that run between 10 and 30 seconds from a particular login, a filter on LoginName equal to the desired login would also be added, combined with the Duration filters using the AND logical operator.
Lines 42-49 of listing 1 show the single Duration filter added with sp_trace_setfilter. The @columnid parameter value 13 is the Duration column ID from the Figure 1 query results. Sp_trace_setfilter does not need an event ID because a trace filter applies to all events with that column rather than a particular event. The @comparison_operator value 4 indicates a greater than or equal to comparison. See table 1 for the complete list of @comparison_operator values.
| @comparison_operator Value | Comparison Operator |
| 0 | = (Equal) |
| 1 | <> (Not Equal) |
| 2 | > (Greater Than) |
| 3 | < (Less Than) |
| 4 | >= (Greater Than Or Equal) |
| 5 | <= (Less Than Or Equal) |
| 6 | LIKE |
| 7 | NOT LIKE |
Table 1: @comparison_operator values for sp_trace_setfilter
SQL Trace in SQL 2005 and later versions records duration in microseconds (one millionth of a second) so, in order to include only batch and RPC events that run 10 seconds or longer, a filter value of 10000000 is needed. The @value parameter data type must match that of the column being filtered. As shown in listing 3, the Duration column data type is BIGINT. It is necessary to use a BIGINT local variable for the filter value in the script because the literal parameter value 10000000 would otherwise be interpreted as INT and result in a data type mismatch error.
The logical operator of this trace filter is insignificant because only one filter is specified. When multiple filters are specified, @logical_operator value zero indicates AND while value 1 indicates OR with the previously added filter.
Start the trace
Run the listing 1 script to create the new trace definition and return the trace ID. Then run the query in listing 3 to list all traces on the instance. In addition to the newly created trace, you may see the SQL Server default trace along with any others you might have created, including running Profiler client-side traces. Unlike server-side traces, client-side traces will contain a NULL path for the trace file destination.
SELECT *
FROM   sys.traces;
Listing 3: List traces script
Now that the trace is defined, trace data can be collected by starting the trace using the sp_trace_setstatus script in listing 4. The script needs to be customized with the actual @traceid of this trace. As I mentioned earlier, sp_trace_setstatus is also used to stop and delete traces. The @status values for these actions are listed in table 2.
 -- start the trace
DECLARE @TraceID int ;
SET @TraceID = 2 ; -- specify value from sp_trace_create
EXEC sp_trace_setstatus
    @traceid = @TraceID
  ,@status = 1 ;-- start trace
Listing 4: Start trace script
| @status | Action |
| 0 | Stops the trace |
| 1 | Starts the trace |
| 2 | Closes the trace and deletes its definition |
Table 2: @status values for sp_trace_setstatus
Viewing Trace Data
Since this trace records only queries that run over 10 seconds, you might need to execute a long-running query (e.g. WAITFOR DELAY '00:00:11') to ensure at least one query satisfies the trace filter criteria. You can view the gathered trace data directly from T-SQL, even while the trace is running by querying the fn_trace_gettable table-valued function. The fn_trace_gettable function requires 2 parameters, trace file path (same as specified on sp_trace_create but with the ‘.trc’ extension) and the number of rollover files to be read. DEFAULT may be specified for the number of rollover files to return data from all rollover files or from a trace without the rollover option. The query in listing 5 will retrieve all of the data collected by this trace. Alternatively, you can view the trace data using Profiler (File | Open | Trace File…).
SELECT *
FROM fn_trace_gettable(N'C:\TraceFiles\LongRunningQueries.trc',DEFAULT);
Listing 5: fn_trace_gettable query
In a later level in this Stairway, I’ll discuss more about fn_trace_gettable along with trace data collection and analysis.
Stop and Delete the Trace
Modify the script in listing 6 to specify the trace id of the long running query trace and then execute the script to stop the trace and delete the trace definition. When you execute sp_trace_setstatus with @status value 0 (stop), SQL Trace stops collecting data for the trace but keeps the trace file open in case you want to resume tracing to the current file with a subsequent start. Therefore, a trace stop is effectively just a pause. But when you execute sp_trace_setstatus with the status value 2 (delete), the trace file is closed and the trace definition is removed from the instance. The file(s) containing the trace data will remain on the file system, though.
 -- stop  the trace
 DECLARE @TraceID int ;
 SET @TraceID = 2 ; -- specify value from sp_trace_create
 EXEC sp_trace_setstatus
    @traceid = @TraceID
    ,@status = 0 ;-- stop trace
 -- delete the trace
 EXEC sp_trace_setstatus
    @traceid = @TraceID
  ,@status = 2 ;-- delete trace
Listing 6: Stop and delete trace script
Summary
SQL Trace database objects are the enabling technology behind server-side tracing. These stored procedures, catalog views, and functions provide the means to create, view, and manage server-side traces using T-SQL and expose trace metadata and functionally that is not available with Profiler. Familiarity with these SQL Trace objects lays the foundation for the more the advanced tracing usage scenarios I’ll discuss later in this Stairway.
