

Introduction
Why would anyone want to code a neural network in SQL Server? Just to see if's possible, or for the fun of it, or to see how the model is, you find your reason. In my case it was for fun, because I wanted to make the Entity Relationship Diagram (ERD) to model a neural network inside a database, and see if it worked like any real neural network would. Later I used Analysis Services Neural Network algorithm to compare its results against mine.
I'll show you in this article the results, the design and the basic concepts. In the next article I'll show you the code and how I worked with Analysis Services Neural Network and Decision Trees and also will explain how to understand the results obtained from it.
Neural Networks Concept
Basically, a neural network (NN) is a system based on the operation of biological neural networks, in other words, is an emulation of biological neural system in the brain. It is designed to "think" like a human brain would, in order to come to a conclusion based on information given to it. To do that the facts are presented to it (in this case, the measured variables and the results obtained with them), so it can "learn" from them and later solve other similar problems. There's plenty of information in the web if you want to know more than this. You can start here http://www.learnartificialneuralnetworks.com/
In the human brain action potentials are the electric signals that neurons use to convey information to the brain and travel through the net using what is called the synapse (the area of contact between the cells, even if there is no physical contact between them). As these signals are identical, the brain determines what type of information is being received based on the path that the signal took. The brain analyzes the patterns of signals being sent and from that information it can interpret the type of information being received.
To emulate that behavior, the artificial neural network has several components: the node plays the role of the neuron, the weights are the links between the different nodes, so it is what the synapse is in the biological net.
The input signal is modified by the weights and summarized to obtain the total input value for a specific node (see diagram below). An "activation function" is used to amplify the results of that input and obtain the value of the particular node.
There are three regions in a NN: the input region which holds one node for each input variable; the hidden region, where there could be several internal layers; and the output region that holds the result sets.
Below is a diagram to help you understand the model:
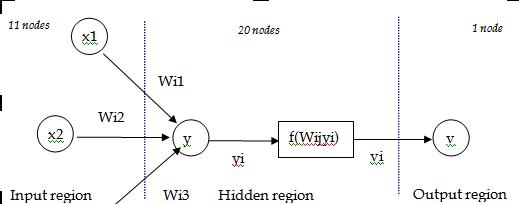
The nodes in the different layers are connected by weighed links. The figure shows the calculation that takes place between several input nodes Xi, the addition of these values in the hidden layer for a particular node Yi=Sum(Wij*Xi) and the application of the activation function to get Vi and the output node to get the value of the output variable.
There are several algorithms used in neural networks, one of them is backpropagation, which is the one I used.
Basically, what the backpropagation algorithm does is to propagate backwards the error obtained in the output layer while comparing the calculated value in the nodes to the real or desired value. This propagation is made by distributing the error and modifying the weights or links between the previous and present nodes. Going backwards, the values of the nodes in the hidden layer can be modified and so can be the weights between the input and hidden layer, but not the values of the nodes in the input layer as they are the values of the variables we are using.
Once the algorithm got to the input layer it goes again forward with the new modified weights and calculates the results in the output layer again. This process is repeated until an error of around 5% is reached (this was my end condition) or another end condition is met.
The data
I wanted to see if I could forecast rain with real weather numeric data. Normally, the rain forecast is made by using NN with graphical data from satellites. So I knew my approach wouldn't be that accurate as I was already aware of that fact, but that didn't bother me at all since I was just testing. I went to get real weather data from the National Meteorological Service in Buenos Aires and they gave me five years of data from one of the observatories in the city. Below is the list of variables:
| Variable | Description |
|---|---|
| Date | Date the measure was taken |
| Month | Month corresponding to date |
| MaxTemp | Maximum Temperature |
| MinTemp | Minimum Temperature |
| MeanTemp | Mean Temperature |
| DueTemp | Due Temperature |
| Wind | Velocity of the wind |
| CloudPct | Percent of the sky covered with clouds |
| Pressure | Mean Pressure |
| Humidity | Percent of humidity in the air |
| SunDuration | Duration of the sun brightness in hours |
| Rain_mm | millimeters of rain |
As the predicted variable I used Probability of Precipitation (PoP) for the next day. To have the real value to use to make the net learn, I calculated PoP for the next day based on the Rainmm variable already in there. This would be a bit variable (1: it will rain tomorrow, 0: it won't rain tomorrow).
The first approach was to use all the variables for the input region, and the output region will only consist of PoP.
The middle region (the hidden layer) will always vary in size depending on the tests and the problem to solve. Usually we'd start with two times the size of the input region and go down until the net learns the correct way and approaches the results in the best way. In my case I started with 20 nodes.
There is a portion of the data set used by the network to learn and the rest is used to test once the network weights have been calculated to see if the network can predict in a accurate way.
The NN code programmed in SQL Server would do the following:
1) Randomly generate the weights for the links between the nodes in the hidden region and the input region.
2) Calculate the values for the nodes in the hidden region and follow the same process to get the values for the variable in the output region.
3) Compare the value in the output variable with the real value in the data set and go back to the hidden region to correct the weights, and so on, until the error between the output value and the real one is smaller than 5%.
The Entity Relationship Diagram
Below is the ERD that shows the design of the database that models the NN.
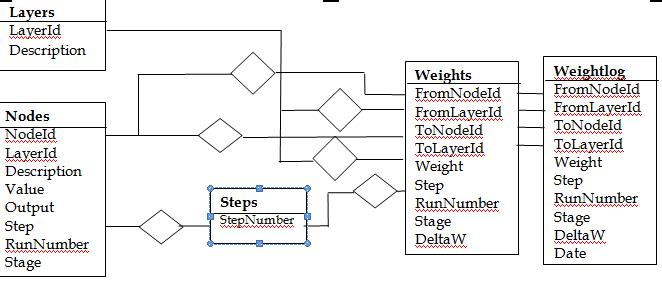
The NN is modelled by the two entities Layers and Nodes.
The Steps entity is used to track the number of times the algorithm goes through the NN as a whole.
The RunNumber in the weights entity is used to track the number of times the algorithm goes through the net within the same data set. The Stage can have two values: "Learning" and "Testing". DeltaW is the difference between the original weight and the weight modified by the calculated error.
Here's the nice thing with SQL Server (or any DBMS): triggers for update can be programmed on the weights table to gather information of what is going on with the weights that were being changed while the network was "thinking and learning" and later get an idea of how that was working from the inside, which is one of the reasons I wanted to do the NN inside SQL Server in the first place.
Experimentation and Results
Now we get to the interesting part where I show you the results. I was really surprised because it wasn't working very well and at first it didn't even predict properly. I will show you the process and how I came up with that conclusion.
First of all, we can say that a NN is able to predict the results of a variable, if the results we get from it are better than the results calculated using any probability calculus. In the case of PoP, as it could only have two values (1 or 0) the probability of error was 50%, so if the network was wrong 50% of the time, then it wasn't predicting correctly.
To analyze what was going on with my NN, I decided I needed extra help, so I used to Analysis Services to really understand why it wasn't working and used a Decision Tree algorithm with the same data I had. This way, I'd know which variable was good to do the prediction of PoP and which wouldn't help at all.
Here's what the decision tree Analysis Services gave me:
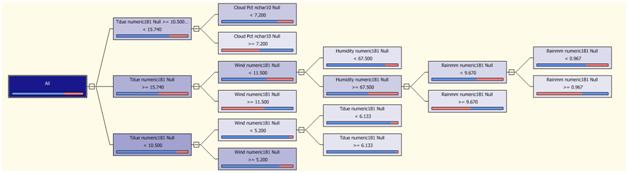
The tree shows that there are a few variables useful in the prediction: TDue, Wind, CloudPct, Humidity and Rainmm. Also, we can see that the prediction is not going to be accurate as the nodes in the tree are not pure (this can be seen in the blue and red bars below the nodes, they show the proportion of the cases with PoP=1 over the total cases for a certain range in the values of the variable shown in the node).
So it's clear from here what variables should be used, and also that the neural network won't be able to be very accurate in the prediction.
So I took out of the input layer the variables that weren't useful and ran the network again in my database, and here is what I found:
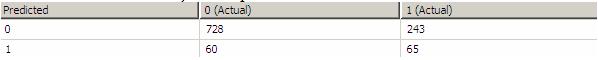
This is the classification matrix, it' is used to show the results of the predicted variable compared to the real values in the learning data. The columns show the real data and the rows the data from the network. In this case, there are 728 cases where the network predicted it wasn't going to rain correctly but in the other 60 cases it predicted it was going to rain and it didn't (false negative). Also, there were 243 cases when the network predicted that it was going to rain and it didn't rain (a false negative)
A false positive is a predicted value of 1 when the real value was 0 and a false negative is exactly the opposite, a predicted value of 0 when the real value was 1. Usually it is desirable to have false positives instead of false negatives as there is less damage in them. As a way to show the impact of a false positive, imagine we are using the NN to predict a disease in a person, a false positive will imply that the person will need to go over more tests to get certain that he or she has the disease whereas with a false negative the person will leave the hospital thinking he or she is healthy.
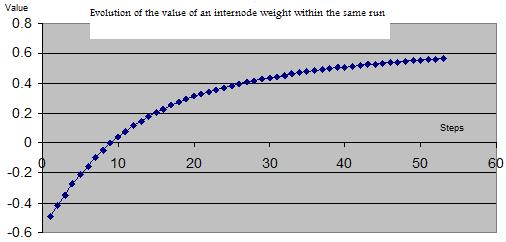
As the NN algorithm goes back and forth to get the correct weights that will allow it to predict the output variable, so the weights vary in value from the initial randomly generated until the final ones that comply with the error of 5% between the desire output value and the predicted value.
Below is the evolution of the weight between two nodes I could gather thanks to the data the trigger logged in the weightlog table:
Summary
I hope this has been as an interesting ride for you as it was for me. I showed you the NN modeled in a database, then we went through the process to analyze the initial results and how to interpret them using SSAS decision trees, and how it helped to give better use to the data to be able to reach the goal of the rain prediction using numeric data with the NN model. Also I explained some of the concepts of the classification matrix an how to read its results and you could see how the internode weight evolved while the network was learning.
My intention is to continue this series by showing how to use SSAS to build the decision tree and also the neural network with this same data, and also to show you the NN database, functions and procedures used to run and test the network.

