

You've got a stored procedure that is running long. It's complex, there are quite a few lines of code with logic that selects, inserts, who knows what. Often we see these types of procedures and SQL with third party applications that we've purchased, but there are times we'll get some code a developer or DBA went crazy with.
I saw someone post some code recently and they were wondering how they could troubleshoot the procedure, which was running slow. Their main question was : how can you determine which part of the procedure is running slow? There are actually a few different ways that I'll go through here, and hopefully help you to tune your code a little better.
Interactively
One of the main ways that you can easily test a stored procedure is to run it interactively and time it. I've usually tested the entire stored procedure with a simple statement like this:
select getdate()
exec MyNorthWindProc
select getdate()
This gives me a quick idea of how long it takes to run a procedure. For those of you that don't want to do the math in your head, or you want to time a few runs, try this:
declare @dt datetime
select @dt = getdate()
exec MyNorthWindProc 'Ana'
select datediff( ss, @dt, getdate()), @dt, getdate()
Now this is good to check overall if the proc runs fast or slow, but it doesn't get you into the details of what is slow. If the proc runs in a substantially different time from that you have otherwise observed, you may need to check things not discussed here.
Let's look at a sample proc here. I'm sure you can determine why this proc takes 10 seconds to run, but this is strictly for an example of how to troubleshoot.
alter procedure MyNorthWindProc
@cust varchar(30)
as
declare @cid varchar(10)
, @cnt int
select @cid = customerID
 from customers
 where companyname like @cust + '%'
waitfor delay '00:00:10'
select @cnt = count(*)
 from orders
 where customerid = @cid
if @cnt > 4
 begin
select sum(od.Quantity * od.UnitPrice)
, sum( discount)
 from [order details] od
inner join orders o
 on od.orderid = o.orderid
 where customerid = @cid
 end
else
 begin
select sum(Quantity * UnitPrice)
, sum( o.freight)
 from [order details] od
inner join orders o
 on od.orderid = o.orderid
 where customerid = @cid
 end
select @cid 'CustomerID', @cnt 'Order Count'
return
go
One of the easy ways to get the timing of when individual statements complete is to add a "print getdate()" after each one. This will result in a bunch of timings being printed in the "Messages" tab of Query Analyzer. The problem with this approach for me has been that it doesn't print seconds, only minutes. Seeing this:
Jul 11 2006  1:49PM
(1 row(s) affected)
Jul 11 2006  1:49PM
doesn't really help me with troubleshooting something where I'm worried about things taking 30 seconds v 2 sec.
There is an alternative. You can cast the getdate() to a different format in the print command and include more details. An quick example of this is shown below (code + results)
print 'Post Declare - ' + convert( varchar(20),getdate(),9)
select @cid = customerID
 from customers
 where companyname like @cust + '%'
print 'Select 1 - ' + convert( varchar(20),getdate(),9)
------
Post Declare - Jul 13 2006  2:46:02
Select 1 - Jul 13 2006  2:46:02
As you can see above, I can easily see that these two statement executed very close together, within the same second. Unless I'm tuning something that runs 10,000 times and split seconds matter, this is good enough for me.
Now let's look at a couple other ways to tackle examining performance.
Profiler
One of the most common tools for checking performance is Profiler. It provides fantastic information on the transmission of data between the server and clients and many people run this first when they see performance problems to see what is going on.
The straight profiler traces, however don't help here. If I connect to my server, click new trace, select "OK" and just run this proc I get something like this:

Basic Trace Results
As you can see from this result that I know my proc took 21 tics of the CPU to execute and 2016ms, but I don't know more than that. So while I can perhaps see if I have a proc that takes 48sec to run, I don't know why.
Fortunately Profiler has a number of features that can help us. If you look at the properties for this trace, you will see that there are events selected, one of which is the Stored Procedures:RPC:Completed event. Since this trace was setup like this, I can't edit it here, but I can start a new trace. Once I do that, I connect, but before hitting "OK", I select the "Events" tab. If I scroll down to the Stored Procedure class, I see these events:

Basic Trace Events
I've moved a few more into the "Selected" side from the "Available" side. However you can see all the events available. For the purposes of tuning the stored procedure, there are two events that are very helpful.
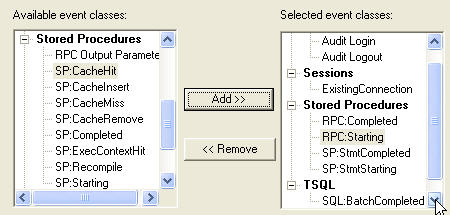
Stored Procedure Events
The events that are most interesting for our purposes are the following four events:
- RPC:Starting
- RPC:Completed
- SP:StmtStarting
- SP:StmtCompleted
These four events will allow us to follow along as our stored procedure is executed. The first two, the RPC ones, are probably not completely necessary as they merely frame the other statements, but they give is a starting and ending point to pick up in the trace, which can be handy if you run multiple statements or even if your stored procedure calls another one.
In the image below, you can see our stored procedure being executed and quite a bit more data being captured.

Extended Trace Results
As you can see there are a few batch statements that come at the beginning and the the first line of the proc, with the double dash (--) starts. I couldn't get the start of the procedure on the same screen, so I left it off and made sure all the individual statements and the end are displayed.
Each statement is essentially listed twice, with a start and end line. The end line gives the duration, so you could just choose these statements, but I like to see the beginning and end, which can help me see if anything strange occurs in the middle.
As I go down the list, I see there are really only 2 statements that have a duration that appears in Profiler. Not that the other statements don't have a duration, but their entire sum is 33ms, and the must be rounding down in Profiler or there is some overhead.
One statement, the aggregate, shows 47ms, which isn't very long and probably not worth our time to troubleshoot. However another statement shows 2000ms or 2 sec. If we check the TextData column, we can see someone left a WAITFOR statement in the proc. If we remove that, we should see some dramatic performance improvement.
Conclusion
There are probably other ways that you can troubleshoot a stored procedure for performance issues, but these are two quick and dirty methods of diving in to find out which part of the stored procedure is slow. One enhancement you could make to track this over time is to make a log table, which would store user id, times, and descriptions, and instead of PRINT statements, insert the data into the log table. This would allow you to check the execution times on a live system over quite a few executions.
Just be sure you keep an eye on the log table and trim down the data once in awhile.
Performance tuning is something of an art and it takes practice. Here I haven't told you how to fix problems, just how to find them. Fixing them is for another day.
©2006 dkranch.net
Steve Jones