

R is a statistical programming language, mainly used for statistical computing and analysis, data mining and machine learning, and it is a very strong tool for graphics and data visualizations. It is a free software environment, is cross-platform (UNIX, Windows, MacOS), with most of the libraries and package development driven by community efforts.
With R Services available in SQL Server 2016, Microsoft is making the R language available for more flexible data analysis, making sharing data insights much easier, and overcoming memory (RAM) limitations. This mean the integration of R into SQL Server makes analysis on larger datasets, real time OLTP analysis and any kind of big data analysis (document system such as Hadoop, Teradata and others) much easier than ever before.
R Integration
Before SQL Server R Integration, many users, as well as many organizations, have had different challenges in terms of overcoming barriers for successful data analysis. Microsoft have stressed and overcome some of the major problems. With R integrated in SQL Server environment, knowledge of data science can now be shared easier and faster as it moves from data scientists to data engineers and data stewards. This ability to offload this work represents also increase in productivity, as the data scientist can now focus on core analysis, shortening the time to deploy the prediction models, and facilitating real-time analytics.
The existing infrastructure (SQL Server databases, roles, access, security) also help operationalize the results as R in SQL Server is built to work on an enterprise scale and can cope with large volumes of data. The use of R will grow beyond a small database and help bring data in cloud as well as data on-premises closer together. In the end, this R environment is built to move faster and better respond to change (in terms of faster preparing new data models, deploying and utilizing machine learning algorithms).
Product family
Revolution analytics was acquired by Microsoft in April 2015. Along with this acquisition, two versions of the R Engine came together: Revolution R Open (abbr.: RRO) for community and Revolution R Enterprise (abbr.: RRE) for commercial purposes.

After the acquisition, Microsoft kept Revolution R Open almost the same, and it became Microsoft R Open. Revolution R Enterprise became SQL Server R Services (this is the in-database version of Microsoft R Server for the Windows operating system on SQL Server) and Microsoft R Server; two products, which were both already available in Revolution R Enterprise. Microsoft R Server (also known as Microsoft R Server Standalone) is primarily for Linux (Red Hat or SUSE Linux distribution) on a Hadoop or Teradata system with support for a connection to Azure Cloud.

Therefore, the product family of Microsoft R language is available as following products:
- Microsoft R Open
- Microsoft R Client
- Microsoft R Server
- SQL Server R Services
The components of Microsoft R Server are presented as:

Microsft R Open
R Open is the enhanced R distribution version by Microsoft, and it is 100% open source. This version is fully compatible with any existing R engine, making also R code fully compatible with existing code. This Microsoft R Open distribution has additional high-performance multi-threaded enhancements (both on Windows or on Linux platforms) when using the Math Kernel Library (MKL) for vector/matrix based mathematical operations.
This edition is fully compatible with the CRAN repository. GitHub packages can also be used within R Open. Unfortunately, R Open is limited by memory available, meaning that only data that can fit into the memory of a computer can be processed. Proprietary ScaleR algorithms and functions (RevoScaleR library) will not run under R Open version (but are available in Microsoft Client and Microsoft Server Version).
R Open will run on any SQL Server 2016 edition, except on Express or Express with Tools. Microsoft R Client / Server will run only on Enterprise or Developer editions.
Microsoft R Client
The R Client version is a 100% free version, built on top of Microsoft R Open. A data scientist can use any CRAN/GitHub based library, This edition introduces the powerful RevoScaleR Library to allow heavy parallelization and multi-threaded computing. The RevoScaleR library is a library using ScaleR technology and its proprietary functions for parallel computation.
There are some limitations to R Client. Firstly, memory is limited to local memory, which means that the data must fit into local memory. ScaleR functions can use parallel computation, but processing is limited to two threads only (regardless of computer having more cores and supporting multi-threated operations). All the computation is limited to client capabilities: disk, ram and speed.
A good thing about Microsoft R Client is that a user can push the computational operations to Microsoft R Server or SQL Server R Services and R Server for Hadoop to achieve better performance. The great part about R Client is that allows user to still run high performance analytics without having Microsoft R Server installed locally but still get all the benefits by using the computational powers of Microsoft R Server.
Microsoft R Client is compatible with following flavors of R Server: Microsoft R server for Linux, Microsoft R Server for Teradata DB, Microsoft R Server for Hadoop, Microsoft R HDInsight and both versions of Microsoft R Server – Standalone and SQL Server R Services.
Microsoft R Server
Microsoft R Server is the most often used version of R in the Microsoft R product family, especially for enterprise analytics purposes. Like R Open / R Client version, it supports all statistical analysis, data mining and predictive analytics with machine learning, but for big data as well. R Server is also fully compatible with CRAN / Github / Bioconductor library repositories, and the ScaleR algorithms with its functions are capable of parallel and multi-threated data processing and computation with data much larger than the server memory suze. An R-based application will be able to use multiple platforms using ConnectR and be deployable across multiplatform as well (using DeployR functions). Disk scalability is also available with this version.
SQL Server R Services (in-database Microsft R Server)
Microsoft SQL Server R Services is essentially in-database version of Microsoft R Server version and it covers most of ScaleR algorithms for scalable and high-performance environment. Memory and disk will be managed by your instance of SQL Server. To support R execution, an additional SQL Server service will be installed locally, called the SQL Server Trusted Launchpad. Also, the Microsoft R Client is capable of communication between SQL Server and R Server; with a slight difference that DeployR and ConnectR functions will not work, as they were prepared for other purposes. But, as already said, ScaleR algorithms will be available also in this database version.
Installation
Microsoft R Server is always installed separately as a standalone version. So, once you install your SQL Server 2016, you will need to install R Server as well, if you would want to have it installed on your server.

SQL Server R Services installation will be prompted as feature selection as R Services (In-Database).

Prior to the installation itself (in both cases of in-database or server version) you are asked for consent to install R Open, which is a base distribution for all the versions.

After installing the Server version or in-database version, additional RevoScaleR library functions will be installed and made available.
R Client and R Open are downloadable from Microsoft MSDN website. R Open is available at MRAN Microsoft website (https://mran.microsoft.com/) and R Client from Microsoft R Client download site (aka.ms/rclient/download). For R Client you must also download the IDE environment and all the accompanying R Libraries (needed for work). For IDE environment, I would recommend R Tools for Visual Studio.
Further in this article, we will focus on SQL Server R Services, as in-database version of Microsoft R Server. and how to handle external stored procedures.
Post-installation
Once you have successfully installed SQL Server 2016 with the in-database R Service, some additional actions will need to be completed. The user doing this must have an administrator rights on the server.
In SSMS you will need to check configuration for ‘external scripts enables’.
EXEC SP_CONFIGURE 'external scripts enabled';
GO
You will need to set the run_value to 1. By default, it is set to 0, so executing the following will change that:
-- Enable execute external script
EXEC SP_CONFIGURE 'external scripts enabled', 1;
GO
RECONFIGURE;
GO
After that, you will need to restart your instance of MSSQLServer. In services, also check that SQL Server Launchpad (MSSQLLaunchpad) is running.

After this, you should be able to start using R in SSMS with T-SQL.
Running R Code using sp_execute_external_script
With SQL Server 2016 a new external stored procedure, SP_EXECUTE_EXTERNAL_SCRIPT, is available. For now, it is used only for running R based scripts, but in the future we might get support for other languages as well. Python is believed to be one that will be included. This stored procedure executes the provided script at an external location – in this case at R Services.
To show how this procedure works, let’s take a look at a dataset on which we would like to make a statistical analysis:
USE WideWorldImporters;
GO
SELECT
        SUM(il.Quantity) AS InvoiceQ
       ,SUM(il.ExtendedPrice) AS InvoiceV
       ,c.CustomerID
       ,c.CustomerCategoryID
              FROM
                     sales.InvoiceLines AS il
              INNER JOIN sales.Invoices AS i
              ON il.InvoiceID = i.InvoiceID
              INNER JOIN sales.Customers AS c
              ON c.CustomerID = i.CustomerID
GROUP BY
        c.CustomerID
       ,c.CustomerCategoryID
This query is returning the value and quantity of invoices for each customer in the WideWorldImporters database. To find some additional customer insights, we would like to see what is the correlation between Customer Category and Invoice Value for each customer. To do this, we will push the data from SQL Server database with the accompanying R Script to R Server.
The code is below:
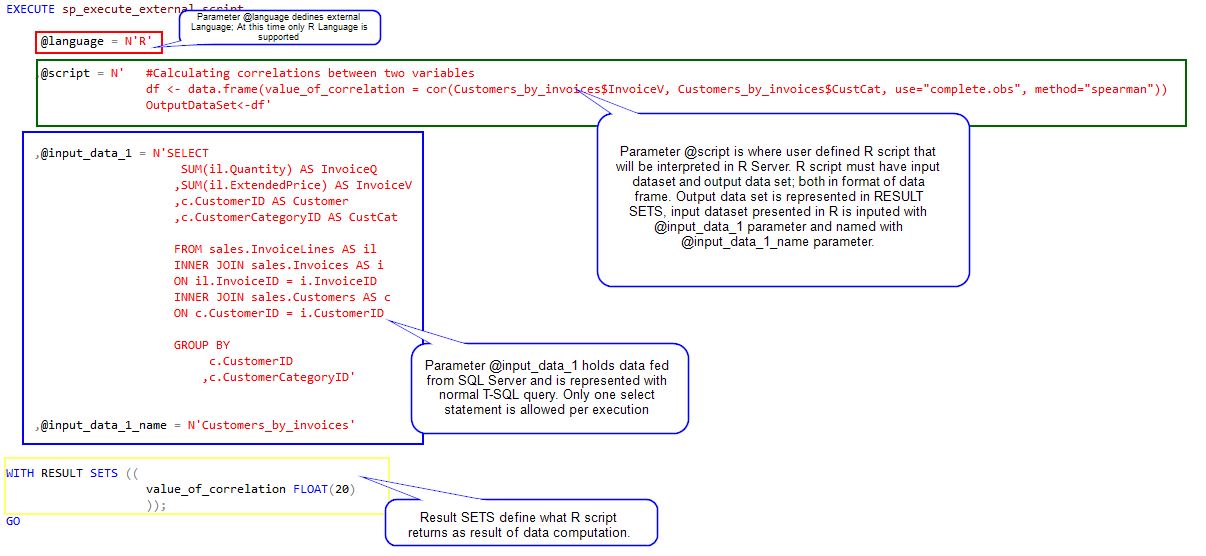
EXECUTE sp_execute_external_script
        @language = N'R'
       ,@script = N'   #Calculating correlations between two variables
                        df <- data.frame(value_of_correlation = cor(Customers_by_invoices$InvoiceV, Customers_by_invoices$CustCat,
                        use="complete.obs", method="spearman"))
                        OutputDataSet<-df'

       ,@input_data_1 = N'SELECT
                                          SUM(il.Quantity) AS InvoiceQ
                                         ,SUM(il.ExtendedPrice) AS InvoiceV
                                         ,c.CustomerID AS Customer
                                         ,c.CustomerCategoryID AS CustCat
                                         FROM sales.InvoiceLines AS il
                                         INNER JOIN sales.Invoices AS i
                                         ON il.InvoiceID = i.InvoiceID
                                         INNER JOIN sales.Customers AS c
                                         ON c.CustomerID = i.CustomerID
                                         GROUP BY
                                                 c.CustomerID
                                                ,c.CustomerCategoryID'
       ,@input_data_1_name = N'Customers_by_invoices'
WITH RESULT SETS ((
                   value_of_correlation FLOAT(20)
                  ));
GO
The result of this query is presented in form of a column within SSMS.

The result of this execution can be stored in table or variable within SQL Server for later purposes and analysis.
The procedure sp_execute_external_script uses the following arguments:
- @language - defines the name of external language. At the time of this article only R language is supported.
- @script - declares R script that will be used for data computation and data analysis in R Server. @script argument must have input and output dataset defined, so R server understands what data are coming in and what is the result of the computation. Input data set is defined with argument @input_data_1 and its name of dataset @input_data_1_name, whereas output data is what R script returns as a result. Results of computation must always be presented in form of data frame.
- @input_data_1 - transact SQL is direct value of this parameter and it can hold only one SELECT statement. Select list is what @script argument will also be using for analysis, so be extra precise what you state in select statement.
- @input_data_1_name - is the name of results returned by transact SQL in argument @input_data_1 and used for presentation in @script argument.
As a result, this procedure is returning only one column with one value, which must be in accordance with output data definition in @script argument.
The R Script is just a simple single line of code:
df <- data.frame(value_of_correlation = cor(Customers_by_invoices$InvoiceV, Customers_by_invoices$CustCat,  use="complete.obs", method="spearman"))
OutputDataSet<-df
This uses two variables: Customers_by_invoices$InvoiceV, Customers_by_invoices$CustCat for calculating the Spearman correlation coefficient between two variables. The result is stored in variable df in the format of a data frame with a column name value_of_correlation. I used the Spearman coefficient because one variable was ordinal and one interval; if both would have been interval, I could have used Pearson correlation coefficient.
Conclusion
Using R Services and R Server brings better data insights with fast data computation and little (if any at all) data movement. Especially with R Server, performance will be enhanced and the size of your dataset will no longer be limited by memory. This tool is perfect for any kind of organization and corporate environment, that wish to shorten the time for creating daily and custom statistical analysis in in later parts we will also see in which areas R as a statistical and predictive tool can be used.
Author: Tomaž Kaštrun (tomaz.kastrun@gmail.com)
Twitter: @tomaz_tsql
