

So youve created your database, run a bunch of indexing, normalized tables as best as you know how, and optimized code, but you still see blocking and sluggish I/O behavior. Your disk I/O seems excessively backed up for what you think it should be, your CPU is pegged high, and you just cant find out what is causing it. You try to capture queries, examine Disk Read queues, and monitor page life expectancy, and all youre really seeing is a lot of what you already knew your code is perfect, structures sublime, and there is no reason whatsoever for the database server to be behaving this way. You grumble that hardware just isnt what it used to be despite advancements in Moores law over the last decade, so you figure youre just going to have to expand your disk array and get some more RAM, maybe even invest in a SAN, and by the way, upgrade to SQL Server Enterprise so that you can cache the entire database in RAM and never have to bother with disk performance ever again.
But wait! Is that really what you need to do? Indeed, hardware today is excellent compared with only a few years ago and if youve been keeping up your skills in SQL design and coding, youre probably more than able to design sleek efficient code that when paired with a well-configured server creates one slick database implementation.
No, perhaps you just need another way to look at how traffic is flowing through your database, something more than the top level Perfmon statistics can provide.
The top level counters offer you a great way to determine overall performance of your databases and servers, but looking at the activity inside your database is beyond the scope of those tools. It would be very useful to see where the traffic is concentrated within your database, not just overall. This article describes a way to see what tables are responsible for most of the data I/O in your database.
Gather the Raw Data
The idea is that we want to find a number that represents the amount of data being shuffled through the cache for each call to the database. To do this, we are going to follow a very basic formula:
Data Flow = Size of Data Element * Number of times it is accessed
Our task is now broken into two steps: Finding a number to represent the size of a data element in the system and finding a number to represent how often the element is touched.
For the first task, finding a number to represent the size of a data element, the gentle reader can borrow some techniques found in Books Online (dbcc showcontig example E) and this site to compile a list of all tables and indexes with relevant statistics on them into a single table. This is basically a modified Cursorless Cursor (http://www.sqlservercentral.com/scripts/viewscript.asp?scriptid=317) that runs
Dbcc showcontig ([tablename]) with all_indexes, tableresults
for each table in the database. Follow this script to run dbcc showcontig on all the tables in the database to compile a list of indexes and tables and their sizes:
CREATE TABLE #tables(
rowid int identity (1,1),
tabid int,
tabname varchar(100)
)

CREATE TABLE CompileIndexesShowContig(
rowid int identity (1,1),
ObjectName sysname,
ObjectId int,
IndexName sysname,
IndexId int,
[Level] int,
Pages int,
[Rows] int,
MinimumRecordSize int,
MaximumRecordSize int,
AverageRecordSize float,
ForwardedRecords int,
Extents int,
ExtentSwitches int,
AverageFreeBytes float,
AveragePageDensity float,
ScanDensity float,
BestCount int,
ActualCount int,
LogicalFragmentation float,
ExtentFragmentation float,
)


declare @tabcount int
, @tabname varchar(100)

--set up "cursorless cursor"
INSERT INTO #tables(tabid, tabname)
select id, so.name
from sysobjects so
where so.xtype = 'U'

select @tabcount = @@rowcount

--count down all the rowids to loop on all tables
WHILE @tabcount > 0
BEGIN

SELECT @tabname = ltrim(rtrim([tabname]))
FROM #tables
WHERE rowid = @tabcount

INSERT INTO CompileIndexesShowContig(ObjectName, ObjectId, IndexName, IndexId, Level, Pages, Rows
   , MinimumRecordSize, MaximumRecordSize, AverageRecordSize, ForwardedRecords, Extents
   , ExtentSwitches, AverageFreeBytes, AveragePageDensity, ScanDensity, BestCount, ActualCount
   , LogicalFragmentation, ExtentFragmentation)
EXEC('DBCC SHOWCONTIG (' + @tabname + ') WITH ALL_INDEXES, TABLERESULTS')

SET @tabcount = @tabcount - 1

END

drop table #tables
What we will be most interested in is the AverageRowSize column. Whenever SQL Server scans for data, it is going to read at least one row of data. This is what we will use to represent the size of the data element mentioned earlier, in this case, an entire row.
The second task, gathering how many times a row is accessed, is accomplished by running a SQL Profiler trace on the database to capture the number of object scans performed. As with any activity you want to do in SQL Server, there are several ways to set this up so well just describe the parameters needed for a useful trace in this exercise. To capture how often a table is accessed, we are simply looking for the number of times an object is touched by a scan (i.e. reading in information) so the only event we really need to monitor for is Scan:Started. Next, we need to set up the columns we would like in the output of the trace. The only columns we absolutely need are IndexID, ObjectID and StartTime. The inclusion of StartTime allows you to narrow in on a particular time range within the trace, but its inclusion, as well as any other fields, is entirely up to you. Finally, we need to set up some filters to focus the trace on just our database and eliminate any unintentional influences. I have found a few filters for my production environment sampling that allow me to continue prodding at my database while the trace is running, but still not unfairly influence the capture of raw data. These filters are:
| ApplicationName | not like | SQLProfiler |
| SQLAgent Alert Engine | ||
| SQLAgent Job Manager | ||
| SQLDMO_1 | ||
| MS SQLEM | ||
| DatabaseID | like | 5 (whatever database id you are monitoring) |
| LoginName | not like | your login name |
| ObjectID | >= | 100 (Exclude System Ids checkbox) |
These filters eliminate all of the SQL Server utility-related traffic and allow for continued ad hoc investigation without skewing results. For purposes of this exercise, the trace is set up to save directly to a table named IndexCapture. You can find out the ID of your database by running:
select name, dbid
from master.dbo.sysdatabases
Summarize the Capture
All this raw data can sure be difficult to analyze, not to mention time consuming! One thing we can do to make our lives easier is to summarize the data. Summarize the raw data into a table by making a summary table, and group all of the scans according to ObjectID and IndexID:
CREATE TABLE IndexCaptureSummary (
rowid int IDENTITY (1,1) not null,
objectid int NULL ,
indexid int NULL ,
scans bigint NULL )

insert into IndexCaptureSummary (ObjectId, IndexID, Scans)
select objectid, indexid, sum(*) as scans
from IndexCapture
group by objectid, indexid
Make it Make Sense
Now that we have a table that shows all the objects, indexes, and how often they were hit, and a table that lists the sizes of the rows of all of the indexes, lets turn these into a number that we can use to represent how much I/O each object is responsible for. We join the two tables we created earlier, IndexCaptureSummary and CompileIndexesShowContig, on ObjectID and IndexID, and create a new computed column called Flow, which is simply Scans * AverageRowSize.
select cisc.objectname, cisc.indexname, ic.scans, floor(scans*cisc.averagerecordsize) as flow
from IndexCaptureSummary ic
inner join CompileIndexShowContig cisc on cisc.objectid = ic.objectid and cisc.indexid = ic.indexid
order by flow desc
At this point, Flow is just a representative number that we can manipulate to give us some idea of how much data I/O to attribute to each object. It could be converted to kilobytes, megabytes, data pages, elephants, or heads of lettuce, whatever works for you! It really does not matter what conversion you apply as long as it is applied consistently and we get a number that is useful for comparisons. In order to make it more readable, we also draw on the ObjectName and IndexName fields.
Analyze the Results
We now can see our scan results married with our object names. We can also see the number of scans for each index and most importantly, a rough idea of how much information is being drawn from each object for the period of time we scanned. The key idea to note is that just because an object is heavily scanned does not mean that it is responsible for your I/O. See this screenshot of our results data (1/2 hour sampling), which was pasted into Excel to allow us to compute some percentages:
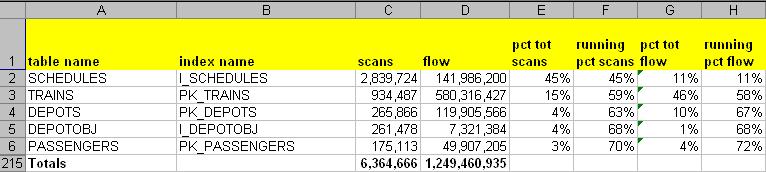
This screenshot shows the top 5 of 214 objects scanned in the database. Clearly, the index on table Schedules is the heavy favorite of scanning, by an order of magnitude and then some. About 45% of all scans in the database can be attributed to it, yet it accounts for only a very small percentage of the total data flow, just 11%. A very different picture emerges when we sort by Flow.
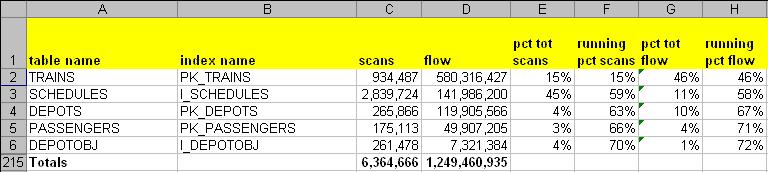
Here, we can easily see that scans on the primary key on the Trains table accounts for a whopping 46% of the total flow, about 4 times the flow of Schedules, despite drawing only 15% of all the scans. The reason for the large difference becomes apparent when we compare the sizes of the top 2 indexes in question:
| Table | Index | AverageRecordSize | Rows |
| Trains | PK_Trains | 682 | 12,776,293 |
| Schedules | I_Trains | 50 | 21,376 |
The primary key of Trains is about 13 times the size of the index of Schedules, which means that there is a considerable amount more data to read for each scan of Trains than of Schedules. Now we can see where our data I/O is concentrated and can determine the next steps towards optimizing our database. Although this technique does not compute precise I/O measurements of each database object (nor is it intended to), it shows us the rough proportions and gives us a place to start working. In this example, perhaps we need reexamine the structure of our heavily trafficked Trains table and normalize it further, or look into alternate access methods. In the real-life situation that this article is based on, neither of the previous options was available because an outside vendor controlled the design of the database and access methods. The solution was to isolate the table by placing it into its own filegroup on its own drive array. This separated the traffic of the Trains table away from the traffic of other objects in the database so that the two sets of traffic were not contending for the same physical disk resources. The I/O congestion and disk queue backups instantly ceased, splitting the total I/O amongst two physical disk resources: one half for this table on its own drive array, and the other half for the rest of the database. It did not solve the inefficiencies inherent in the design of the application, but it sure made them manageable!
Conclusion
In this exercise, we examined how we can trace the I/O of our database down to individual objects in our database. We can see that just because an object is scanned heavily, it does not mean that that object is responsible for our database traffic. By combining the size of the rows scanned with the number of scans, we can determine a rough percentage of I/O that can be attributed to each object. Certainly, there can be hotspots in the database where there are several tables or indexes that need examining, and this technique can help discover places that the reader may start looking for efficiencies.
