

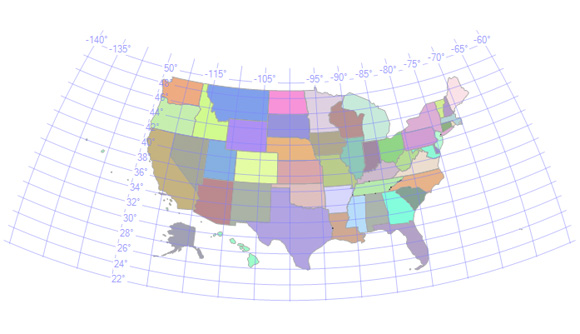
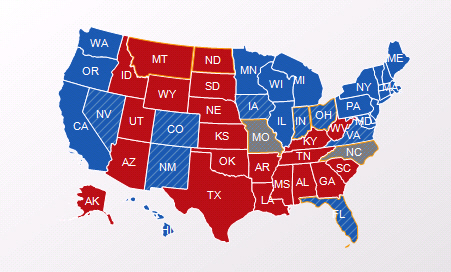
Map is one of the exciting new features introduced in SQL Server 2008 R2. Although the Map Gallery, Map Wizard, and Map Layer Wizard make it very easy to display spatial data on the report, there is no out-of-box template that displays a map often seen in news publications, such as CNN:

In this article, we will demonstrate a process to transform US Census' TIGER/Line shapefile to display CNN-style map in Reporting Services. The following data/tools are used in this article:
- SQL Server Spatial Tools: http://sqlspatialtools.codeplex.com/
- US State shapefile: http://www2.census.gov/geo/tiger/TIGER2008/tl_2008_us_state.zip
- Morten Nielsen's Shape2Sql tool: http://www.sharpgis.net/page/SQL-Server-2008-Spatial-Tools.aspx
The source code and database are attached at the end of the article.
Install SQL Server Spatial
SQL Server Spatial Tools contains a collection of functions and aggregates for spatial data. Specifically, we will use AffineTransform functions to scale and reposition Alaska and Hawaii. The installation process is rather straightforward. All you need to do is to unzip the package, locate the path to the dll file, and run Register.sql. After the installation, you can test it by executing this query:
SELECT AffineTransform::Scale(.25, .25).Apply(GEOMETRY::Parse('POLYGON((0 50, 2 50, 1 51, 0 50))'))
Load the Shapefile
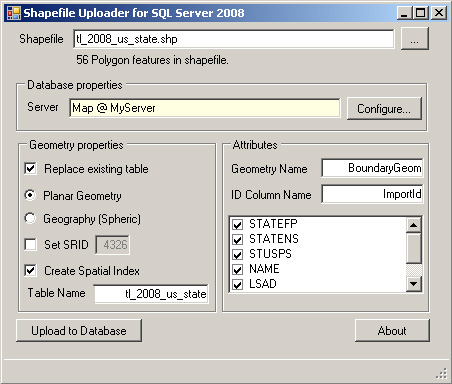
After SQL Server Spatial Tools are installed, we will use Shape2Sql to upload the shapefile in tl_2008_us_state.zip into SQL Server. This process is a actually more complicate than it seems because some states in this shapefile cannot be directly loaded as Geography data type. Fortunately, a great article: Fixing Invalid Geography Data details the steps needed to complete this task. Here is a summary:
- Unzip the tl_2008_us_state.zip and SqlSpatialTools.zip files.
- Double click on Shape2Sql.exe and upload tl_2008_us_state.shp to SQL server as Geometry data type:

- Convert Geometry to Geography
ALTER TABLE [tl_2008_us_state]
ADD BoundaryGeog GEOGRAPHY
UPDATE  tl_2008_us_state
SET     BoundaryGeog = GEOGRAPHY::STGeomFromWKB(BoundaryGeom.MakeValid().STAsBinary(), 4326)
WHERE   NAME NOT IN('Massachusetts', 'New Mexico', 'Wyoming', 'Montana', 'Texas', 'North Carolina', 'Arizona', 'Tennessee', 'Utah')
UPDATE  tl_2008_us_state
SET     BoundaryGeog = GEOGRAPHY::STGeomFromWKB(BoundaryGeom.STUnion(BoundaryGeom.STStartPoint()).MakeValid().STAsBinary(), 4326)
WHERE   NAME = 'Massachusetts'
UPDATE  tl_2008_us_state
SET     BoundaryGeog = GEOGRAPHY::STGeomFromWKB(BoundaryGeom.STBuffer(0.00001).STBuffer(-0.00001).MakeValid().STAsBinary(), 4326)
WHERE   NAME IN ('New Mexico', 'Wyoming', 'North Carolina', 'Tennessee')
UPDATE  tl_2008_us_state
SET     BoundaryGeog = GEOGRAPHY::STGeomFromWKB(BoundaryGeom.Reduce(0.00001).MakeValid().STAsBinary(), 4326)
WHERE   NAME IN ('Texas', 'Montana', 'Arizona', 'Utah')
Transfer Data from Pre-stage Table to Production Table
Once the Geography field in tl_2008_us_state is fully populated, the table is ready to be transferred to the production table. During this step, the Reduce() function is called with 250 tolerance to simplify boundary polygons, which will in turn improve report performance. The MapSetId flag is needed later in the Reporting Services and will be further investigated.
CREATE TABLE dbo.[State]
(
    StateFips VARCHAR(2) NOT NULL,
    StateAbbrev  VARCHAR(2) NOT NULL,
    StateName  VARCHAR(50) NOT NULL,
    BoundaryGeog  GEOGRAPHY NOT NULL,
    MapSetId INT NOT NULL
    CONSTRAINT departments_pk PRIMARY KEY (StateFips)
);
INSERT  dbo.[State]
SELECT  STATEFP AS StateFips,
        STUSPS AS StateAbbrev,
        NAME AS StateName,
        BoundaryGeog.Reduce(250) AS BoundaryGeog,
        1 AS MapSetId
FROM    dbo.tl_2008_us_state
WHERE   STUSPS NOT IN ('AS', 'MP',  'VI', 'GU', 'PR')
CREATE SPATIAL INDEX SIX_State ON dbo.[State](BoundaryGeog);
Scale and Reposition AK and HI
During this step, we will use AffineTransform functions from SQL Server Spatial Tools to scale and reposition Alaska and Hawaii. Because AffineTransform functions only apply to Geometry data type, we need to convert Geography to Geometry, perform affine transformation, and convert Geometry back to Geography. After some trial and error, the following transformations produce similar shapes to our target map.
-- ::::::::::::::::::::::::::::::::::::::::::::::::::::
-- Reposition AK
-- ::::::::::::::::::::::::::::::::::::::::::::::::::::
DECLARE @StateFips VARCHAR(10)
DECLARE @BoundaryGeog GEOGRAPHY
DECLARE @BoundaryGeom GEOMETRY
SELECT  @BoundaryGeog = BoundaryGeog
FROM    dbo.[State]
WHERE   StateAbbrev = 'AK'
-- Convert to GEOMETRY
SET @BoundaryGeom = GEOMETRY::STGeomFromWKB(@BoundaryGeog.STAsBinary(), 4326)
-- AffineTransform
SET @BoundaryGeom = AffineTransform::Scale(.15, .25).Apply(@BoundaryGeom)
SET @BoundaryGeom = AffineTransform::Translate(-93, 13).Apply(@BoundaryGeom)
-- Convert back to GEOGRAPHY
UPDATE  dbo.[State]
SET     BoundaryGeog = GEOGRAPHY::STGeomFromWKB(@BoundaryGeom.MakeValid().STAsBinary(), 4326)
WHERE   StateAbbrev = 'AK'

-- ::::::::::::::::::::::::::::::::::::::::::::::::::::
-- Reposition HI
-- ::::::::::::::::::::::::::::::::::::::::::::::::::::
DECLARE @StateFips VARCHAR(10)
DECLARE @BoundaryGeog GEOGRAPHY
DECLARE @BoundaryGeom GEOMETRY
SELECT  @BoundaryGeog = BoundaryGeog
FROM    dbo.[State]
WHERE   StateAbbrev = 'HI'
-- Convert to GEOMETRY
SET @BoundaryGeom = GEOMETRY::STGeomFromWKB(@BoundaryGeog.STAsBinary(), 4326)
-- AffineTransform
SET @BoundaryGeom = AffineTransform::Scale(1.25, 1.25).Apply(@BoundaryGeom)
SET @BoundaryGeom = AffineTransform::Translate(89, 2.5).Apply(@BoundaryGeom)
-- Convert back to GEOGRAPHY
UPDATE  dbo.[State]
SET     BoundaryGeog = GEOGRAPHY::STGeomFromWKB(@BoundaryGeom.MakeValid().STAsBinary(), 4326)
WHERE   StateAbbrev = 'HI'
Here is what our map looks like after these steps:
SELECT  BoundaryGeog,
        StateAbbrev
FROM    dbo.[State]
The map looks fairly close to what we want except the small Northwestern Hawaiian Islands are trailing off to the west of California. To filter out those small islands, we will first create a radius that is big enough to cover the main islands, then call STIntersection() to get the intersection of main islands' shapes and the radius' shape. Here is our final transformation:
UPDATE  dbo.[State]
SET     BoundaryGeog = GEOGRAPHY::Parse('POINT(-107 28)').STBuffer(500000).STIntersection(BoundaryGeog)
WHERE   StateAbbrev = 'HI'
SELECT  BoundaryGeog,
        StateAbbrev
FROM    dbo.[State]

Rectangular States
Finally, we need to create 9 rectangular states: VT, NH, MA, CT, RI, NJ, DE, MD, and DC in the Atlantic Ocean:
SELECT  'VT' AS StateAbbrev, 1 AS Ordinal INTO #RectState
INSERT  #RectState SELECT 'NH', 2
INSERT  #RectState SELECT 'MA', 3
INSERT  #RectState SELECT 'CT', 4
INSERT  #RectState SELECT 'RI', 5
INSERT  #RectState SELECT 'NJ', 6
INSERT  #RectState SELECT 'DE', 7
INSERT  #RectState SELECT 'MD', 8
INSERT  #RectState SELECT 'DC', 9
DECLARE @RectSpacing FLOAT
DECLARE @RectHeight FLOAT
DECLARE @Lat1 FLOAT
DECLARE @Lat2 FLOAT
DECLARE @Lon1 FLOAT
DECLARE @Lon2 FLOAT
DECLARE @iRectState INT
DECLARE @Wkt VARCHAR(1000)
DECLARE @Geog GEOGRAPHY
DECLARE @Geom GEOMETRY
SET @RectSpacing = 1
SET @RectHeight = 2.5
SET @Lat1 = 46.5
SET @Lat2 = @Lat1 - @RectHeight
SET @Lon1 = -66
SET @Lon2 = -62
SET @RectSpacing = 1.0
SET @iRectState = 1
WHILE @iRectState < 10
BEGIN
    SET @Wkt = 'POLYGON((' +
        CAST(@Lon1 AS VARCHAR(10)) + ' ' + CAST(@Lat1 AS VARCHAR(10))  + ',' +
        CAST(@Lon1 AS VARCHAR(10)) + ' ' + CAST(@Lat2 AS VARCHAR(10))  + ',' +
        CAST(@Lon2 AS VARCHAR(10)) + ' ' + CAST(@Lat2 AS VARCHAR(10))  + ',' +
        CAST(@Lon2 AS VARCHAR(10)) + ' ' + CAST(@Lat1 AS VARCHAR(10))  + ',' +
        CAST(@Lon1 AS VARCHAR(10)) + ' ' + CAST(@Lat1 AS VARCHAR(10))  +  '))'
    -- Wkt -> Geog
    SET @Geog = GEOGRAPHY::STPolyFromText(@Wkt, 4326)
    -- Geog -> Geom
    SET @Geom = GEOMETRY::STGeomFromWKB(@Geog.STAsBinary(), @Geog.STSrid)
    -- Calculate bounding box
    SET @Geom = @Geom.STEnvelope().MakeValid()
    -- Geom -> Geog and Insert
    INSERT  dbo.[State]
    SELECT  S.StateFips,
            S.StateAbbrev,
            S.StateName,
            GEOGRAPHY::STGeomFromText(@Wkt, 4326) AS BoundaryGeog,
            2 AS MapSetId
    FROM    dbo.[State] S
            INNER JOIN #RectState B ON S.StateAbbrev = B.StateAbbrev AND B.Ordinal = @iRectState
    SET @iRectState = @iRectState + 1
    SET @Lat1 = @Lat1 - @RectHeight - @RectSpacing
    SET @Lat2 = @Lat2 - @RectHeight - @RectSpacing
END
Note that the 9 rectangular states' MapSetId are set to 2. The reason for putting them in different set from the Census' state shapes (whose MapSetIds were set to 1) is because we will use Bonne projection and planar projection respectively for MapSetId=1 and MapSetId=2 in Reporting Services. The following figure shows shapes in different projections.

Finally, let’s input some data to stylize the shapes. For the demonstration purpose, we will style the map similar to the CNN map we displayed in the Introduction section.
CREATE TABLE dbo.StateData
(
    StateFips VARCHAR(2) NOT NULL,
    FillColor VARCHAR(20) NOT NULL,
    FillPattern VARCHAR(20) NOT NULL,
    BorderColor VARCHAR(20) NOT NULL,
    TextColor VARCHAR(20) NOT NULL
)
INSERT  dbo.StateData
SELECT  StateFips,
        '#185aad' AS FillColor,
        'None' AS FillPattern,
        'White' AS BorderColor,
        'White' AS TextColor
FROM    dbo.[State]
WHERE   StateAbbrev IN ('WA', 'OR', 'CA', 'MN', 'WI', 'IL', 'MI', 'PA', 'NY', 'ME', 'HI') OR MapSetId = 2
INSERT  dbo.StateData
SELECT  StateFips,
        '#185aad' AS FillColor,
        'BackwardDiagonal' AS FillPattern,
        'White' AS BorderColor,
        'White' AS TextColor
FROM    dbo.[State]
WHERE   StateAbbrev IN ('NV', 'CO', 'NM', 'IA', 'VA')
INSERT  dbo.StateData
SELECT  StateFips,
        '#185aad' AS FillColor,
        'BackwardDiagonal' AS FillPattern,
        '#f79404' AS BorderColor,
        '#f79404' AS TextColor
FROM    dbo.[State]
WHERE   StateAbbrev IN ('IN', 'OH', 'FL')
INSERT  dbo.StateData
SELECT  S.StateFips,
        CASE WHEN S.StateAbbrev IN ('MO', 'NC') THEN '#7b7a79' ELSE '#bc0b16' END AS FillColor,
        CASE WHEN S.StateAbbrev IN ('MO', 'NC') THEN 'DottedDiamond' ELSE 'None' END AS FillPattern,
        CASE WHEN S.StateAbbrev IN ('MO', 'NC', 'MT', 'ND') THEN '#f79404' ELSE 'White' END AS BorderColor,
        CASE WHEN S.StateAbbrev IN ('MO', 'NC', 'MT', 'ND') THEN '#f79404' ELSE 'White' END AS TextColor
FROM    dbo.[State] S
        LEFT OUTER JOIN dbo.StateData D ON S.StateFips = D.StateFips
WHERE   D.StateFips IS NULL
Creating Map Report
In Reporting Services, we will start by creating a Data Source to the database and a DataSet for the map data:
SELECT  S.StateAbbrev,
        BoundaryGeog,
        S.MapSetId,
        D.*
FROM    dbo.[State] S
        INNER JOIN dbo.StateData D ON S.StateFips = D.StateFips

Then drag and drop a Map report item onto the canvas. As discussed in the section above, we will need two Map items: one displays Census’ state shapes in Bonne projection and another one displays 9 rectangular state shapes in planar projection. Let’s start with the first one.

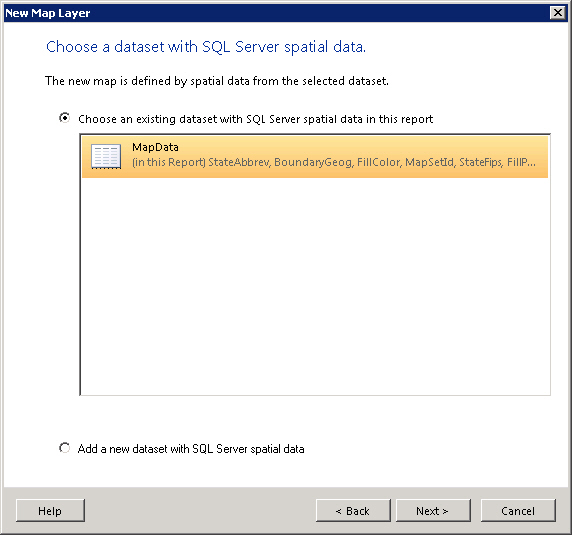
Follow the wizard to select MapData as the dataset:
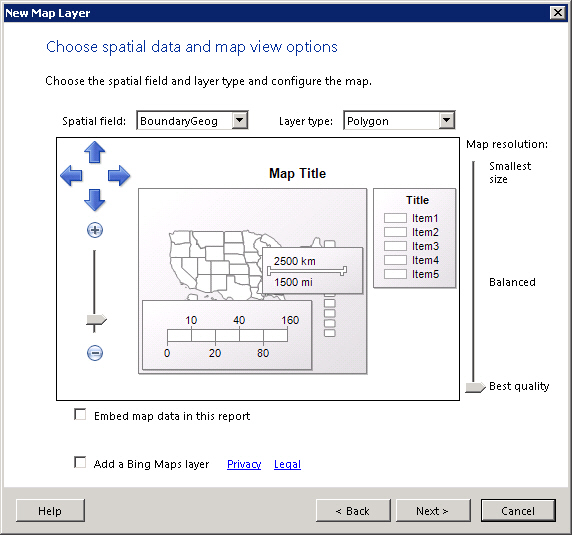
Accept the default value and click on the Next button for the next two steps:

Check Display labels and select StateAbbrev as the data field:

After the wizard, clean up the map by deleting unwanted components, such as title, color scale, distance scale, and legend. The map should look like:

Now, we need to limit the map to display only Census’ state shapes. Right click on the polygon layer, select Layer Data, set a filter on MapSetId = 1.


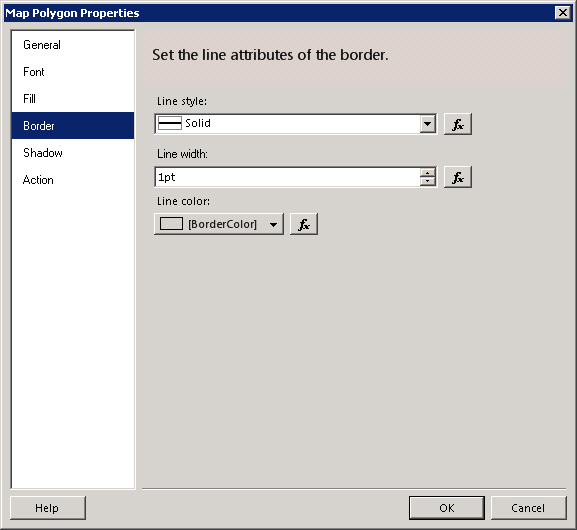
Next, configure the shading by changing the polygon properties. Right click on the polygon layer, select Polygon Properties, change font color to white and fill color and border color to use data fields:


Finally, go to Viewport Properties and change Projection from Mercator to Bonne.

The map now looks like:
Now, let’s proceed to create the second map for the 9 rectangular state shapes. The steps are basically the same as the first map except the filter is set to MapSetId = 2 and projection is set to Planar (X, Y). After both maps are created, change map views’ center and zoom to nicely position the two maps side-by-side. Also hide maps’ border and change background color to white. After these cosmetic touch ups, the report will look like:

Conclusion
SQL Server 2008 R2 Reporting Services can display spatial data from three different sources: Map Gallery (RDL file with embedded spatial data), ESRI shapefile, or SQL Server Spatial Query. In this article, we choose to use the third option and store spatial data in SQL server (as opposed to RDL or shapefile) because it allows us to easily manipulate spatial data. For example, if your organization groups Alaska, Hawaii, and other western states into the same sales region, the sales region map can be easily created by applying the GeographyUnionAggregate() aggregate to the dbo.[State] table we created:
SELECT  'Western Sales Region' AS Label,
        dbo.GeographyUnionAggregate(BoundaryGeog) AS BoundaryGeog
FROM    dbo.[State]
WHERE   StateAbbrev IN ('AK', 'HI', 'CA', 'AZ', 'UT', 'WA', 'NV', 'ID', 'OR')


