How to Determine Activity on Each Processor in SQL ServerHow to Determine Activity on Each Processor in SQL Server
The contents of the SELECT, WHERE and ORDER BY clauses are all a matter of determining the story you need to tell.

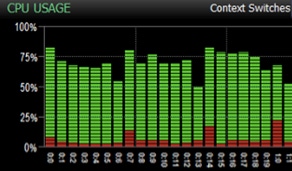
I was asked to look into an issue recently where a 40-core SQL Server instance was fully utilizing a one node over all others--to the point that all cores for that node were appearing as being consistently “pegged” at 100 percent. My client was looking to determine the root cause of this issue, so they could pull in the correct team to resolve. The biggest question besides why this was happening was whose expertise to rely upon to identify the root cause and fix whatever was causing this:

SQL Server Processor Usage_1
I already had a query that provided information about what was currently running. That query utilizes a handful of SQL Server Dynamic Management Objects (a.k.a. DMOs) to return that information:
sys.dm_exec_sessions
Provides data about sessions on the SQL instance. A user (or system process) needs to first make a connection to the instance. When this occurs, a session is spun up and a session_id is assigned. The session_id is a unique identifier for the session.
sys.dm_exec_requests
Returns information related to actively running requests. Within the context of a session, a user executes queries that are processed by the query engine. Queries and requests are synonymous in this regard.
sys.dm_exec_sql_text
The use of this function provides insight into the text of the T-SQL command that is at the core of any request. By passing in a sql_handle for a parameter to this function (a sql_handle is a unique identifier for a batch of code), you can not only return the full batch text, but also isolate the current command in the batch being serviced. This is evident when you see the code below.
I’ve used this combination of objects in multiple ways during the past dozen years to extract information as to who is doing what on the SQL Server instances for which I’m responsible. The core of their use (columns returned can change depending on what I’m interested in learning about the current activity) is the following set of JOIN operations:
FROM sys.dm_exec_sessions AS S
INNER JOIN sys.dm_exec_requests AS R ON S.session_id = R.session_id
CROSS APPLY sys.dm_exec_sql_text(R.sql_handle) ST
By joining sys.dm_exec_sessions to sys.dm_exec_requests on session_id you lay the foundations for identifying all activity running on a SQL instance at any given time. This doesn’t give you all the details, however. To return the query text that is executing you need to perform a CROSS APPLY to sys.dm_exec_sql_text. A CROSS APPLY will pass in a parameter for every matching row in the query for execution by the function. In the case of what’s at the core of our query above, this means that there will be a repetitive call of the sys.dm_exec_sql_text function for every row in sys.dm_exec_requests. In SQL Server queries are processed in a different order logically than they’re written. The FROM clause is evaluated first, followed by the WHERE clause. (SELECTs are evaluated futher along in the query optimizer.) This means that you should take heed when using CROSS APPLYs because they will be executed for every row from sys.dm_exec_requests before we filter out rows we’re not interested in. (We filter for specific processor node if we wish to look at a problem like what was at the heart of this issue we’re discussing today.)
For more on logical query processing check out Itzik Ben-Gan’s excellent series on the subject.
Now having this core set of Dynamic Management Objects configured, I was able to add to it. I just had to determine how to associate requests and sessions with processors. The key was an often-overlooked column in sys.dm_exec_requests: scheduler_id. Requests are assigned to a scheduler based upon the load/pressure on each scheduler. Each processor node has multiple schedulers assigned. Using the scheduler_id from sys.dm_exec_requests we can join to another Dynamic Management Object, which allows us to roll the activity up from requests and sessions to schedulers and processor nodes: sys.dm_os_schedulers. Our FROM clause now looks like this:
FROM sys.dm_exec_sessions AS S
INNER JOIN sys.dm_exec_requests AS R ON S.session_id = R.session_id
INNER JOIN sys.dm_os_schedulers AS SC ON R.scheduler_id = SC.scheduler_id
CROSS APPLY sys.dm_exec_sql_text(R.sql_handle) ST
At this point it’s simply a matter of deciding which columns will provide the insight we need. sys.dm_exec_requests is rife with metadata around load (CPU, IO, memory), and many columns such as the previously mentioned sql_handle that can be used to flesh out additional details. You can use the above combination to associate load to its assigned processor node. The contents of the SELECT, WHERE and ORDER BY clauses are all a matter of determining the story you need to tell.
In my case, I was tasked with identifying which queries were running on a specific node whose individual processors were consistently 100 percent utilized. To satisfy what was being asked of me, I wanted to ensure I could identify the processor node, scheduler, session, request and database for each query being processed by the SQL instance in doubt. I also wanted to get information around the start time for the executing queries and any wait information. (I was specifically interested in CPU-based waits of any kind.) Then I wanted some insight into the load for each processor node, which was information readily available in sys.dm_exec_requests. I utilized the CROSS APPLY to sys.dm_exec_sql_text to get the T-SQL code submitted. Since I was interested in a particular processor node, I was able to limit the results to just that node_id. Node_id is the unique identifier for any node in a SQL Server instance and is the primary key for sys.dm_os_nodes, which is a DMV that provides deeper insight into each processor node than we dive into in this article. The parent_node_id column in sys.dm_os_schedulers is the foreign key referencing node_id from sys.dm_os_nodes:
SELECT SC.parent_node_id, R.scheduler_id, R.session_id, R.request_id
, R.start_time, R.database_id
, R.wait_type, R.wait_time, R.last_wait_type
, R.cpu_time, R.total_elapsed_time, R.logical_reads, R.parallel_worker_count,
SUBSTRING(ST.text, R.statement_start_offset / 2,
( CASE WHEN R.statement_end_offset = -1
THEN DATALENGTH(ST.text)
ELSE R.statement_end_offset
END - R.statement_start_offset ) / 2) AS statement_executing
, ST.text
FROM sys.dm_exec_sessions AS S
INNER JOIN sys.dm_exec_requests AS R ON S.session_id = R.session_id
INNER JOIN sys.dm_os_schedulers AS SC ON R.scheduler_id = SC.scheduler_id
CROSS APPLY sys.dm_exec_sql_text(R.sql_handle) ST
WHERE SC.parent_node_id = 5
ORDER BY 1, 2;
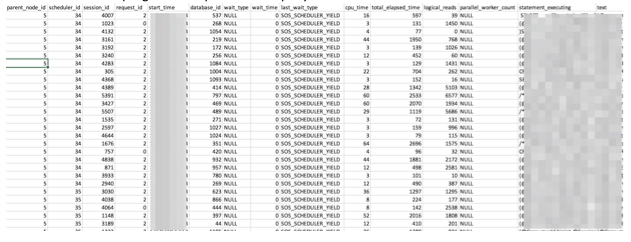
What follows is a sampling of the output from this query:

SQL Server Query Output
This is another one of those scripts you tuck into your toolbox. You’re not likely to use it every day, but you know you’ll need it some day.
About the Author
You May Also Like


.jpg?width=700&auto=webp&quality=80&disable=upscale)

