In this article, we will introduce Microsoft Fabric and how it relates to Power BI Premium Capacity we will turn to the mechanics of capacity utilization, and we will briefly look at how to monitor the performance loads of our Fabric resources. In a future article we will dive into performance tuning of Fabric workloads.
While this is not the first Fabric post on this site (There have been quite a few!) Fabric went GA (Generally available) last week, and our new writer Fabriano Richard, is here with his first post on the subject as well.
What is Fabric?
In simple terms, Fabric is a new data platform introduced in May 2023, to provide complete analytical possibilities in one single environment. In other words, with Fabric there is a single interface from which we can work with our data reporting needs. All of the tools and view points live under one roof, i.e. under the roof of the Power BI portal.
Here is a brief architectural picture, showing what experience packages are offered (Image from Microsoft overview here):
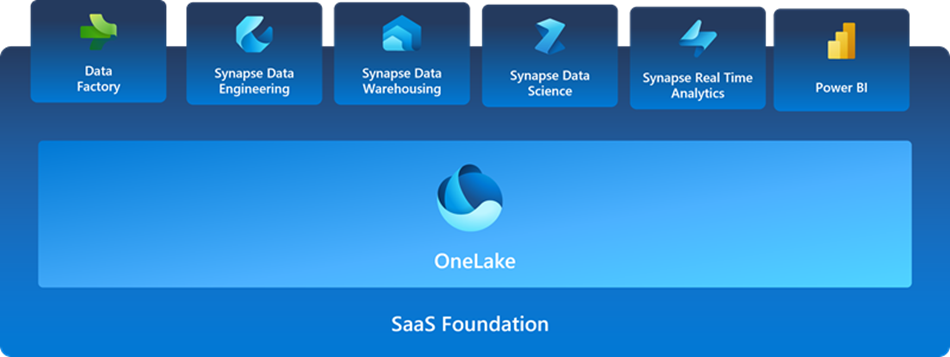
Image embedded from: https://learn.microsoft.com/en-us/fabric/get-started/microsoft-fabric-overview
What this means is that in the Power BI interface we can do much more: we can have our data transformation pipelines, our machine learning, data warehousing, real-time analytics etc, under one roof without even going to the Azure portal. Most importantly, we can visualize our data from here without needing to navigate to a different tool or portal.
Is this “an old wine in new bottles”, one may wonder.
At first glance, it may seem so. But on a deeper look, there are some significant improvements and benefits.
Before we dive deeper into the topic, a bit of clarification. Microsoft Fabric is a new umbrella for some Azure and O365 services, which means that Fabric is part of the Power BI section of O365, and Fabric is directly related to the Premium Capacity functionality of Power BI service.
This means that Fabric enables a new way of working, new possibilities, and synergies, but some of them (especially the internals) will still be there even if the Microsoft Fabric functionality is not enabled for use as part of the Premium Capacity environment. Hence, in this article I may use the words “Fabric” and “Premium capacity” interchangeably.
One of the major new things with Fabric is how there is a single copy for all compute activity. This means that now there is a real separation between storage and compute – there is a single place where the data resides, called OneLake, and all computes can access it and speak the same language.
We may have different workloads – T-SQL, Spark, KQL and so on, and this would mean that they would need to be computed differently. But Fabric actually provides a single serverless compute under this umbrella. (For more details, you can see Microsoft’s overview here)
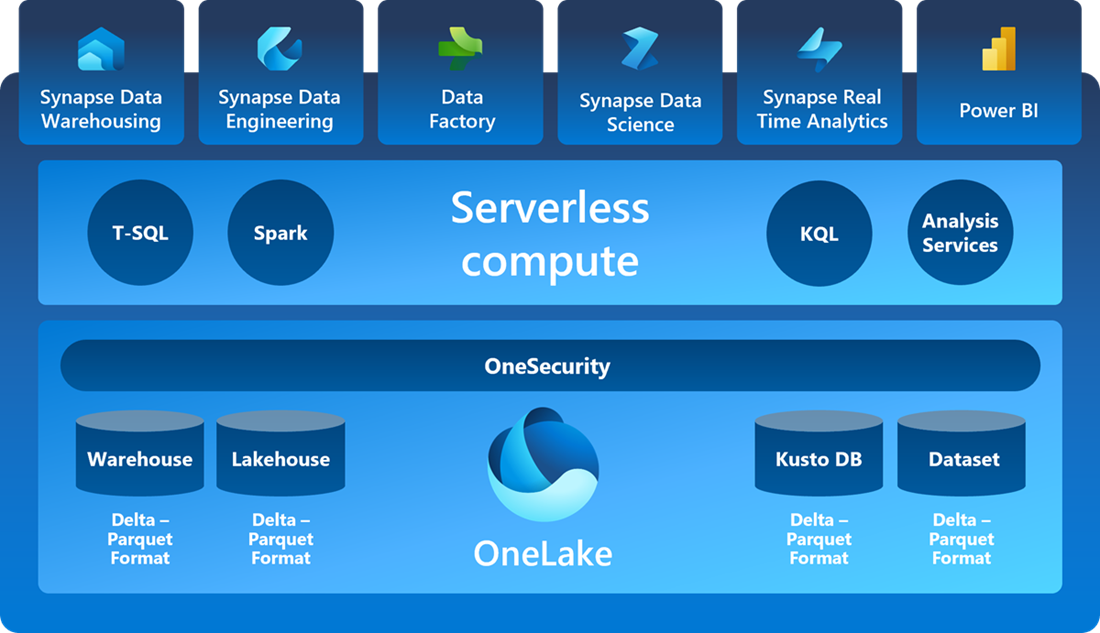
Image embedded from: https://learn.microsoft.com/en-us/fabric/get-started/microsoft-fabric-overview
The data in the OneLake is stored in a parquet format, an open popular format, furthermore the data is compressed to provide the best performance in PBI and all engines are optimized to work with this data format.
One great brand-new feature to mention is the introduction of DirectLake feature, which allows us to query data from Power BI directly from OneLake.
Previously, we have had two options – Direct Query or Import mode for Power BI analysis. As you can see in the picture below, Fabric introduces a third option, called DirectLake which combines the best of both worlds.
In a future article I will demo how well it works on a near-real-time reporting over a dataset of 10 billion records with 150million records incoming daily. For now, you may read more about the DirectLake feature here (https://learn.microsoft.com/en-us/power-bi/enterprise/directlake-overview).
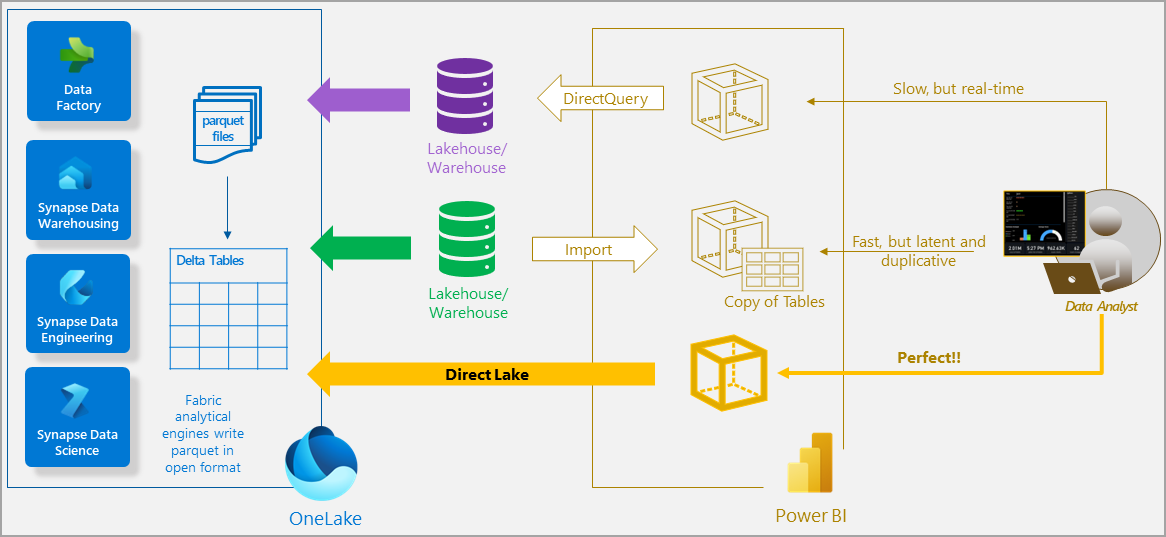
Images embedded from https://learn.microsoft.com/en-us/power-bi/enterprise/directlake-overview
Just to mention one of the reasons why the above performance gain is possible – it is because we do not lose any time on translations between query languages. In DirectLake mode, there is no need to translate to SQL language – the Delta -Parquet format understand DAX queries.
To recap, all of this comprises the concept of unified SaaS platform for all our analytical needs – everything is in the same place, data is centralized and does not move, all computes are separate from the data, but they have access to it and they speak the same language without the need of translations.
This, however, creates the need for some changes in the capacity management.
Capacity management
The general idea is that Fabric uses the same capacity as Power BI Premium. Capacity in this case means what amount of virtual resources are purchased – they are accounted as memory and CPU, which are allocated to an organization. These are so called Universal Compute Capacities, which are available to all users within a Premium Capacity.
There are some parallels between a capacity and a VM (virtual machine):
- When we get a VM, we choose the number of CPU cores we want. In the case of a capacity, we also get to choose what scale we need to purchase. In both cases we get the possibility to scale, at a certain cost, of course.
- The CPU cores are dynamically shared between all apps in a VM (unless we do some allocations and administration, given that the application allows it). In the case of a Fabric capacity everything is shared without any pre-allocation possible. A single capacity can run any compute engine – DataWarehouse, Spark, ML and so on.
- The total consumption of the CPU in a VM cannot exceed the total 100% available, unless we do some scale-up, and in the case of Fabric, there is a auto-scale functionality as well. If the auto-scale is not enabled in Fabric, then throttling of the entire capacity will happen, under certain conditions.
All of this means that the Capacity (whether or not it has Fabric enabled) is on autopilot and it manages itself, there is no need to do any resource management work from the user’s side. Also, large heavy jobs can now be scheduled at any time, and the risk of a single user disturbing all other users in the capacity by running a very large job is mitigated by the concept of smoothing.
Smoothing is used to stabilize the peaks in the capacity, to smoothen the high loads in the resource consumption. There is a different mechanism for smoothing depends on the operation: batch jobs, refreshes and background operations are smoothened over 24 hours, whereas user queries are smoothened over 5 minutes intervals, which prevents a single query to overload the entire capacity.
In reality, when we purchase a premium capacity, we are paying for an average load, and not a maximum load. As mentioned, Smoothing is not new, and you may read more about it here (https://learn.microsoft.com/en-us/power-bi/enterprise/service-premium-smoothing).
One interesting point to make here is that the Smoothing provides an alternate reality of our environment’s resource utilization, and we may not know what the real performance of our tasks are. Microsoft uses the data after the smoothing for billing and for reporting, and as far as a regular paying user is concerned, there is less throttling and less billing than before this feature was enabled. I doubt that we as users would get the real data before the smoothing in any way. (there are ways to get our hands on part of the telemetry data from Microsoft, I will describe this later on in the article.)
There is a brand-new strategy, released recently, called Bursting. It is another concept worth noting, which allows jobs and queries to run at peak performance regardless of any other computing happening on the capacity. Bursting provides extra compute resources to jobs and queries to accelerate their completion.
So, if we have a capacity with a certain CU limit, and we have a job which will complete in 60 seconds, the capacity may see that there are other CUs currently available (from a pool of other Microsoft customers), then there might be a temporary allocation of CUs, and our job can finish in 15 seconds because of the parallelism. All of this is done behind the scenes and we will not be billed for any bursts because the system takes care of the peaks by using Smoothing first.
What happens if the utilization reaches the Premium Capacity limits?
In short, the Premium capacity gets overloaded. This is when the Smoothing kicks in. If the overload continues for 10 minutes, then and interactive delay is introduced. If the overload continues in full for 60 minutes, then an interactive reject takes place. And if the overload continues for 24 hours, then there is a background reject.
Interactive operations means on demand requests triggered by the user via the UI: data model queries triggered by interacting with visuals, or by a custom application to run a DAX query.
Background operations are scheduled and interactive refreshes.
So, interactive delay will slow down the interactive operations if the overload continues for more than 10 minutes. Interactive reject means that no new requests will be accepted if the overload continues for more than 60 minutes. And background reject means that No refreshes can be performed.
In reality, this means that the users will have 23 hours of being unable to execute any queries before the refreshes get rejected.
Fabric metrics app overview
But how do we monitor our Fabric capacity?
The way to get an overview of the performance of our Fabric is to use the Fabric Capacity Metrics Report. This is an app available for installation via the App Store here, and here are some detailed instructions on how to install it and how to use it.
When installing the app, it will create a separate Workspace in your Premium Capacity, it will load some data after a while and you will be able to see some visualizations of the resource utilization.
One of the first things to notice in the app would be the CU % Over time:
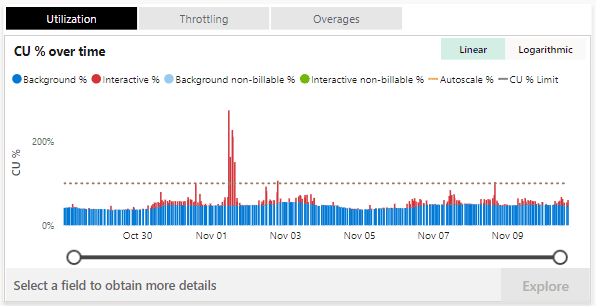
As we discussed earlier, this is the picture after Smoothing, which we get our billing based on. From the above picture we can tell that there was an occasion when the resource capacity was exceeded for a longer period, so now we can check the Throttling tab and see that indeed there was some Interactive delay which had happened.
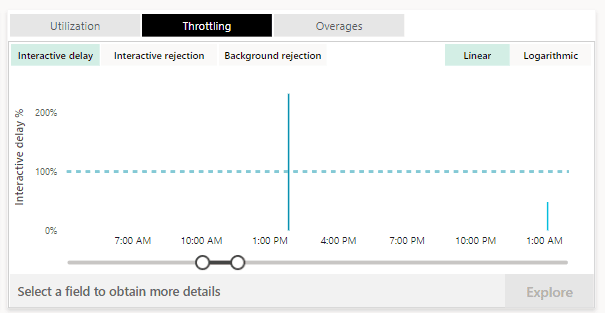
The great thing is that we can actually click on Interactive delay and then click on Explore to see more details in context:
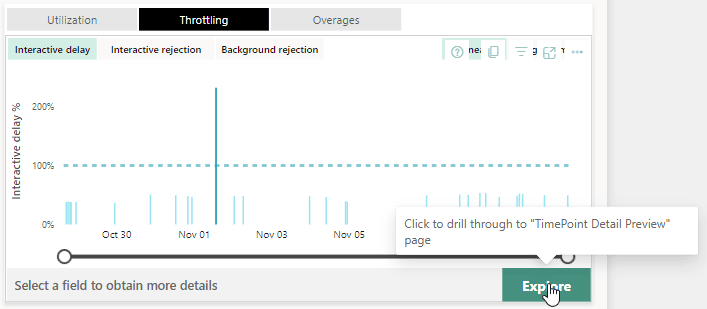
When we click Explore we will find a full report of the context of the throttling:
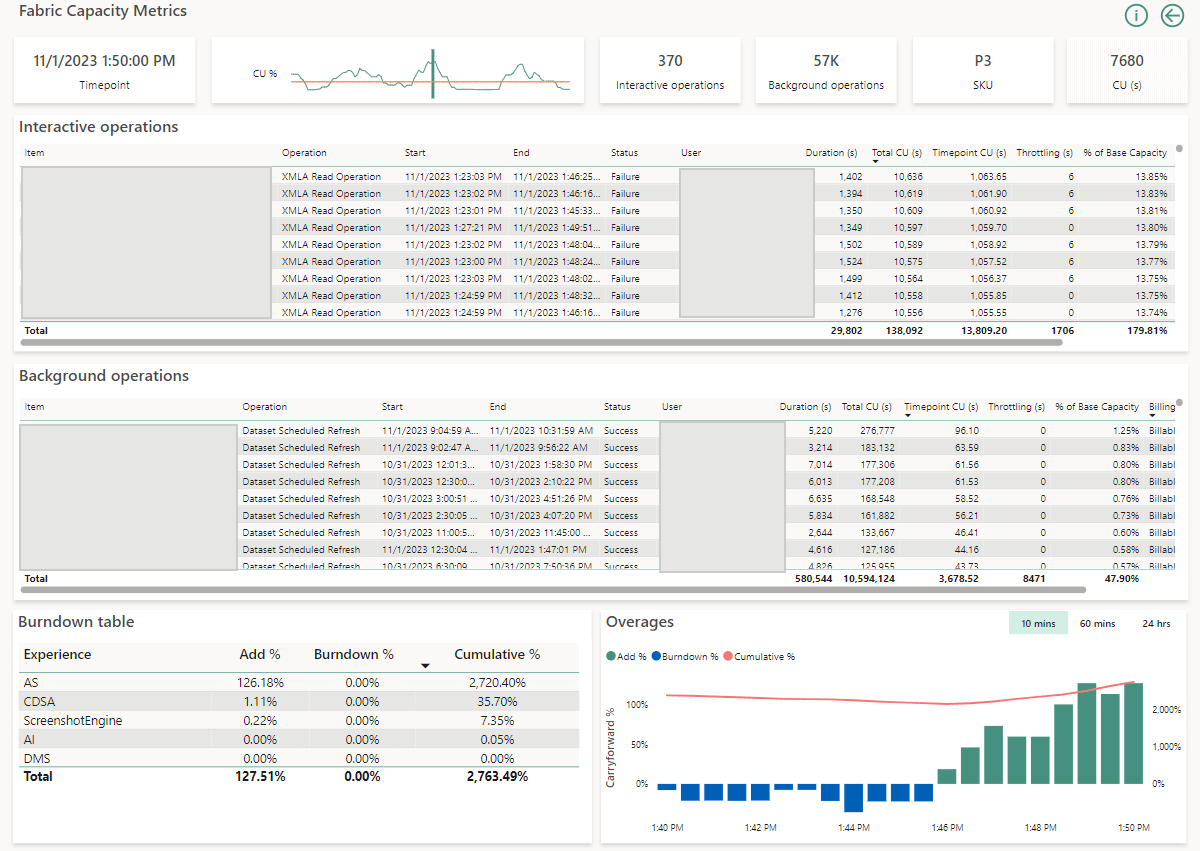
From the above picture we can see that there were 370 interactive operations, which were submitted over a very short intervals, most of them have the status Failure, each one of them has a fairly long duration and high CU utilization.
This is a good start, especially since we would be able to grab the username and the Item name and investigate further.
One downside, however, is that we are not able to see queries or any other execution context from the Power BI portal. In an upcoming article I will show how to dig deeper into performance tuning of the Power BI service workloads.
Summary
As asked earlier, is Microsoft Fabric something new, or is it yet another buzz of the month?
It seems there are quite a few changes in the Power BI, but also in the way we handle analytics, computes and even security.
For one, the newly released improvements offer simplified architecture and infrastructure. We can focus much easier on the actual tasks at hand instead of spending a lot of time making sure the different Azure services can communicate with the data and with each other.
Another great improvement, as mentioned is the choice by Microsoft to use the open-source Delta Lake as the underlying format for all the compute engines.
Finally, my personal favorite is the Direct Lake mode. As mentioned briefly above, it combines the best of both worlds: the Direct query and Import mode. Or is it really something new? Back in the day we had MOLAP and ROLAP.
Plus, Power BI Premium has always been doing clever dataset swapping from memory, if they haven’t been used for a while. The dataset is paged to disk and brought to memory only when users start querying it. With the Direct Lake the files are stored in Delta Parquet format, it is a VertiPaq format, just like the Analysis Services Tabular engine. And this means that the files can be brought to memory without the need to do a refresh operation.
For now, Fabric is still quite new, lets see what the future brings to it.
(In a future article I will demonstrate the functionality of the Direct Lake mode over a very large dataset and will do some near-real-time Power BI visualization.)
Load comments