Many organizations have suffered revenue loss and customer dissatisfaction in recent years due to the poor quality of data maintained by them and their inability to deal with the problem. Because organizations can grow through acquisitions as well as organically, they can suddenly be faced with the task of integrating widely different data across systems that were never designed for the purpose. It is quite usual to face data quality issues and anomalies during the process of integration when several systems exchange data between each other. The systems and the programs used for the exchange of data can grow into a complex and impenetrable mass of patched processes that are constantly redesigned and upgraded in the light of changing business requirements. Each time data is exchanged between two systems, there is a potential risk that the data that is sent may not be consistent on reception, or the transmission system may error out. These errors and discrepancies must be resolved to ensure data consistency.
Even the most tightly-run systems can experience data errors. For example, a procurement system in a manufacturing company may have errors and issues such as overpayment or underpayment of invoices due to incorrect pricing master data present in the system. Also it may have errors such as duplicate invoices being generated or partial orders being placed due to missing codes in vendor system. In consequence, an accounting system at the end of month may have balance that may not match with the cash in company’s bank account due to these issues.
The first stage is detecting the problems rapidly, and monitor their resolution. To resolve these data quality issues, most organizations as a general practice adopt manual processes where operational staff periodically compare data across systems using spreadsheets. This process is time consuming and prone to human errors. Also, it can become a nightmare for the operations team in most organizations to resolve such errors and discrepancies given the intricacy of the interaction of many systems with each other in complex networks. In addition, unless there is good coordination by management, there can be duplicate manual reconciliation processes in different departments which will result in duplicate effort and cost to the organization.
In the past, the very attempt to automate the process of reconciling data across systems has itself caused even more complexity. The use of dedicated ‘reconciliation’ databases or applications between two communicating systems has often resulted in mushrooming of more applications or databases which in turn needed to be reconciled for data inconsistencies.
The more recent design approach has been to use a central repository called Reconciliation Hub that will act as a single source for reconciling transactional data. The Reconciliation Hub can be part of data quality improvement program within an organization and can complement a Master Data Management (MDM) program aimed at improving master data quality and forming a single source of truth for master data such as customer, product etc. In the same way that an MDM program reconciles master data across systems, a reconciliation hub can be used to reconcile transactional data.
The transactional data in reconciliation hub can be both quantitative and qualitative. Quantitative data can be in form of different numeric amounts such as premium, invoice amount etc. and qualitative data can be in form of different descriptions such as name, address etc. The quantitative data can also then be aggregated at different levels of granularity as required. In addition, both the transaction sent and discrepancies received over a period of time can be compared and the root cause identified so as to lessen the frequency of error.
The hub can be built using the data mart architecture which is used to integrate information across various sources. Other alternatives to data mart architecture such as data lakes are suitable when comparing unstructured data. Different layers in the architecture are described as below:
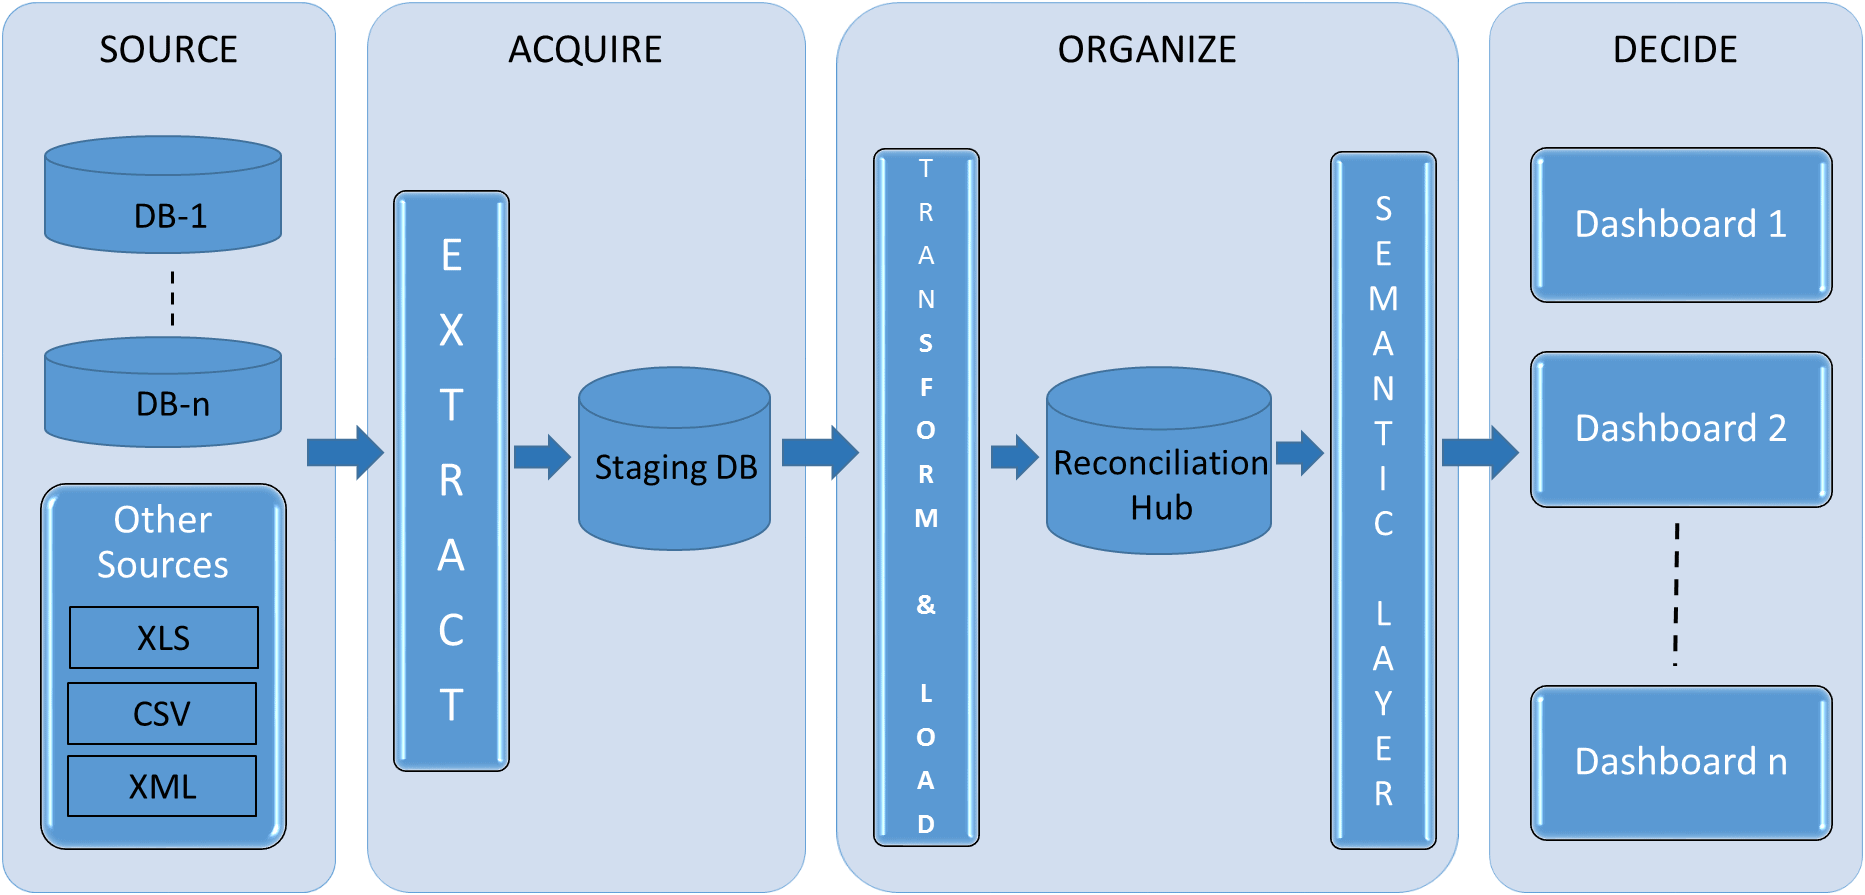
SOURCE: This is the layer where the systems which need to be reconciled are identified along with the mechanism of extracting data from these systems. In its simpler form in this layer, data from different systems can come in various forms such as from database directly or from various file formats (such as xls, csv, xml etc.).
ACQUIRE: The data from source layer is fed into staging area which has replicated data or file structure as in the source systems. This layer is used for cleansing, combining and loading data into the organize layer. It also offers other benefits of the greater flexibility in data loading to next layer and de-coupling the source from the Data Mart.
ORGANIZE: The data from staging is fed into the Reconciliation Hub which has a dimensional star schema structure of facts and dimensions. This structure is optimized to provide advanced analytics and reporting capabilities and also has the benefit of providing easier querying and having better performance. The join logic that is used to retrieve data from this structure is simpler than it is with normalized structures used in transactional applications. In this area, the granularity of data coming from different sources can be assessed and the data with lower granularity can be rolled up to give aggregated view of discrepancies. This detailed and aggregated data from different sources can then be compared to provide the number of discrepancies at different levels. Correspondingly, detailed and summary fact tables can be designed to support the detailed and aggregated view.
It is customary to use Slowly Changing Dimensions (SCD) in dimensional modeling, and type 2 SCDs can be used to provide and track a history of discrepant records in the Reconciliation Hub. For example, if a record was discrepant in May and then resolved in June, the history of when it became discrepant and when it got resolved can be tracked using type 2 SCDs.
An Extract, Transform and Load (ETL) tool is used to load data from different sources to staging and into the Data Mart. Depending on data latency requirements and the volume of data; ETL can be optimized to operate in multiple threads as needed. The ETL batch can run in night after close of business and feed into the existing Data Mart to provide the refreshed view of discrepancies on daily basis.
The semantic layer will allow end users to explore data using business terminology that is easy to understand. This layer will provide an easy-to-use interface to business users to run queries and perform technical analysis.
DECIDE: This is the front end layer for business users. In this layer, a variety of different BI reporting tools such as Microsoft BI suite dashboards can be used to display both summary and detailed level data. Using these dashboards from reconciliation hub, analysts and operational teams can get better insights into source of discrepancies, in which systems the discrepancies happened and the actions taken to resolve those discrepancies.
A business process can be set up that allows the analysts and users to look into the dashboards to find details about the discrepancies. Based on the analysis, the root cause of issue can then be identified. The root cause can be either a source issue, in which case the system involved may need to be fixed, or a processing issue (either technical or human error) in the interface. If the root cause is due to human error, analysts can take action to go into actual systems to resolve the discrepancy. If the issue is due to technical error or problems inherent in the systems, then tickets can be assigned to appropriate technical teams to resolve the issues. As the issues get resolved, the resulting cleaner data is then fed into reconciliation hub which can keep track of when the discrepancy occurred and was resolved, and also do comparisons with cleaner data from different systems on an ongoing basis (daily or in pre-defined regular intervals) recording the history of when the discrepancy was originally found, between which systems and the steps taken to resolve the issue so that it doesn’t re-occur. In either case the processes and systems can be improved on ongoing basis once the root cause is identified. As the systems and processes mature over time using the reconciliation hub, significant cost benefits can be realized in terms of reduced errors and better data consistency across different systems.
Let’s take an example, where we have different files or databases identified as sources for comparing data. Using the ETL process, the data is extracted from the sources into the staging layer which has same structure as that of the source. From staging area, the data is loaded into organization layer of reconciliation-hub which has a de-normalized star schema as below:
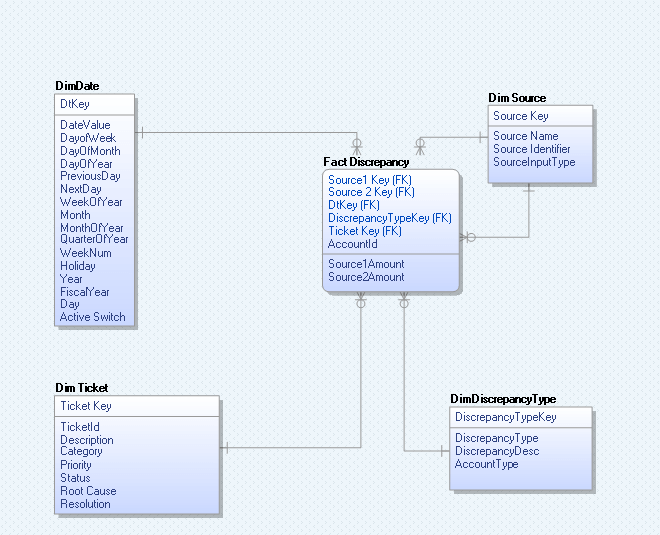
Dim Date: This contains an entry for every day and additional descriptive fields like Year, Month, Previous Day, and Next day. It provides the means to study the trend of discrepancy data over a period of time.
Dim Source: Enables users to view discrepancies by source. This captures the identifying information about the data sources. In case of files, it stores file names, timestamps on files. It also stores the date and time when the data was extracted from the database.
Dim Discrepancy: Stores the various types of discrepancies across different processes. It can be a type 2 dimension to track the history of discrepancy i.e. when it was reported, the date it was opened and closed etc.
Dim Ticket: This contains the ticket details which are assigned to individual technical teams of source systems in which issue has been identified.
Fact Discrepancy: Stores the numeric values of the discrepancy.
Implementation in Microsoft Data Tools (MSDT 2012) SSIS
As an example, I am going to show how recon hub can be set up using Microsoft SQL Server Data Tools (SSDT) to compare data and find discrepancies between two source systems. Consider two source systems (Source1 and Source2) which exchange data with each other based on the set of account ids. For each of the account ids there is an amount which needs to be reconciled between the two systems.
Let’s assume that in the staging we have tables (STG_SOURCE1) and (STG_SOURCE2) which are loaded from two different source OLTP systems. These stage tables have similar structure as shown below.
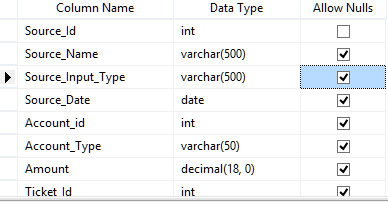
So what we need to do now is to compare the data in the two stage tables and load the discrepancy data into the fact table by fetching keys from dimension tables. We also assume that data in dimensions is loaded using simple sql insert scripts.
Getting Started
To create a SSIS package go to File Menu, click New and then click Project as shown in the screen below:
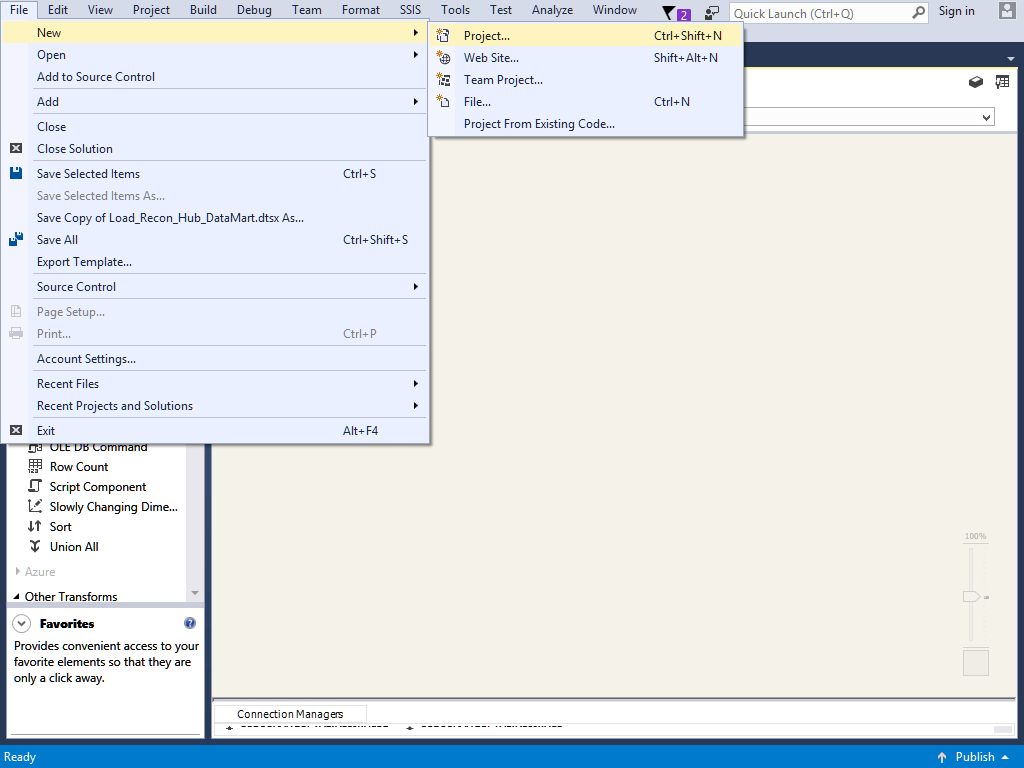
It will launch the dialog box as shown below:
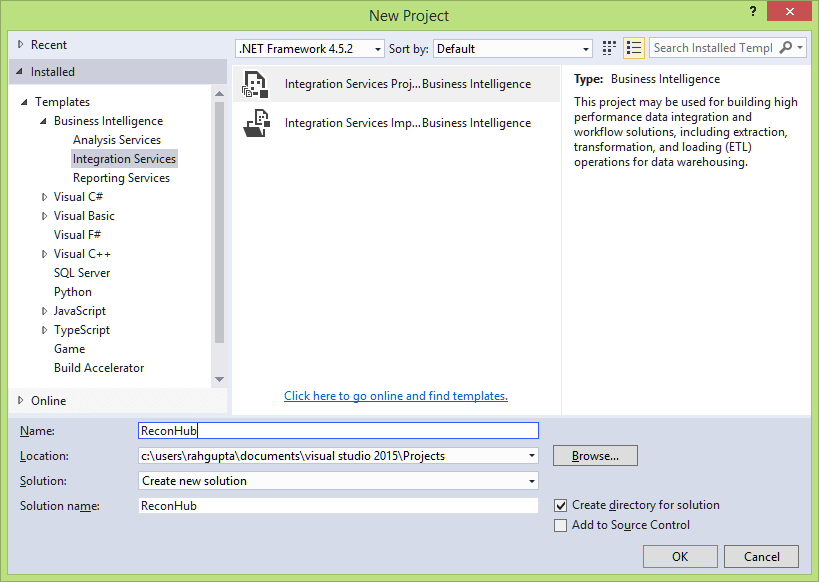
In the new project dialog box, select the integration service Project template, provide the project name (in my case I have provided ReconHub) and select the location of the folder where you want the project files to be saved.
Build SSIS Package for the Recon Hub
As shown below, this is part of the workflow that we are going to build:
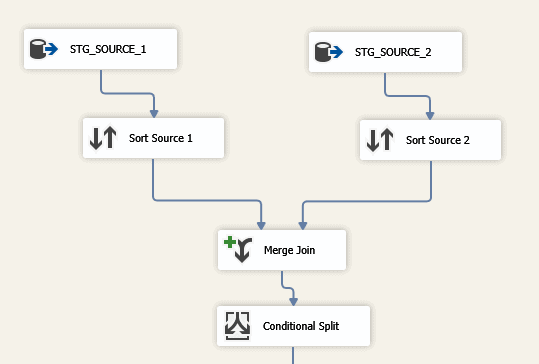
- Stg_source1 and Stg_source2: First we get the records from the two source systems in stage table’s stg_source_1 and stg_source_2.
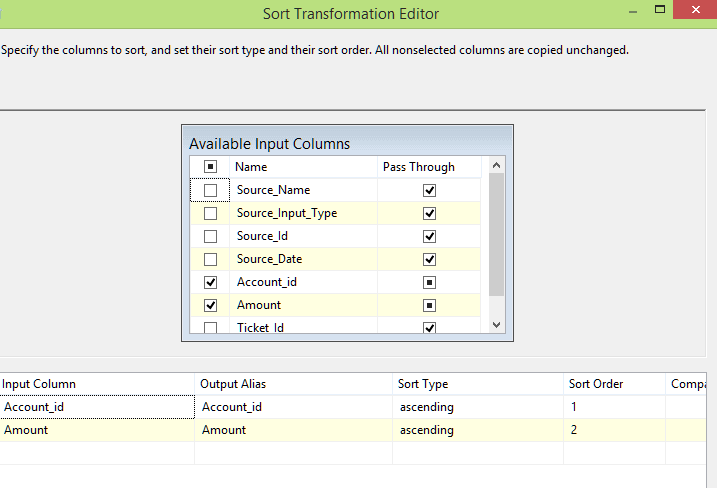
- Sort Source1 and Sort Source 2: We sort the data in the two source based on the account ids.
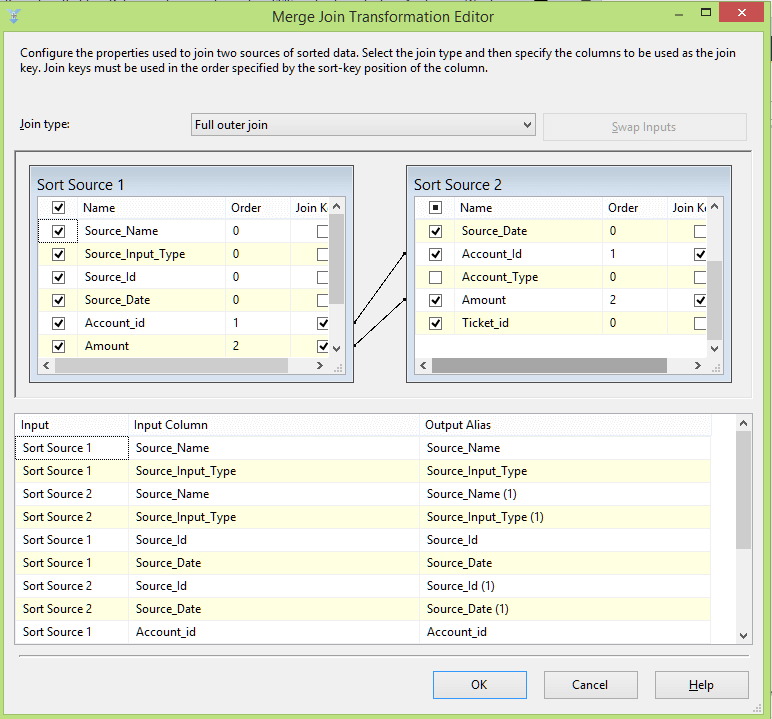
- Merge Join: We join the data in the two sources based on the account id.
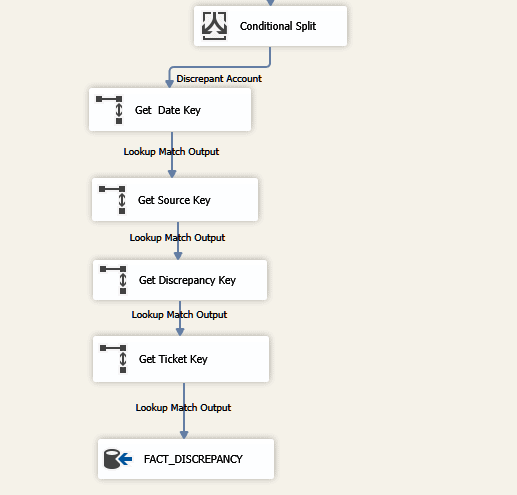
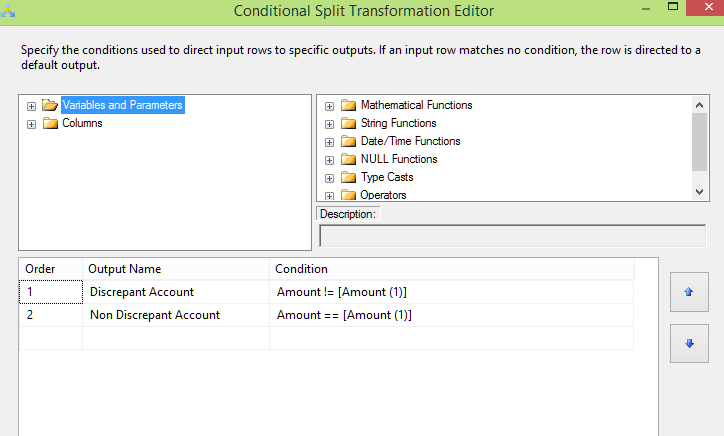
- Conditional Split: We then split the data into discrepant and non-discrepant by comparing the amounts between the two systems based on the ids.
- Get Date Key: From the Source1 Date we get the date when the transaction originally happened in the source 1. We then go to the Date Dimension to get the Date Key for this Transaction Date.
- Get Source Key: Corresponding to the source systems Source 1 and Source 2 we get the source identifiers. We then go to the Source Dimension to get the source key for these ids.
- Get Discrepancy Type Key: For the discrepancy data based on the discrepancy in amount we know the discrepancy type as discrepancy in amount. We then go to the Discrepancy Type Dimension to get the Discrepancy Type key.
- Get Ticket Key: For the discrepancy found we can build a business process and assign a ticket id to the discrepancy. We then go to the Ticket Dimension to get the Ticket Key for these ids.
- Populate Fact Discrepancy: After the data in dimensions are inserted and dimension key populated we then insert the records into the Fact Discrepancy.
-
Stg_Source 1 and Stg_Source 2
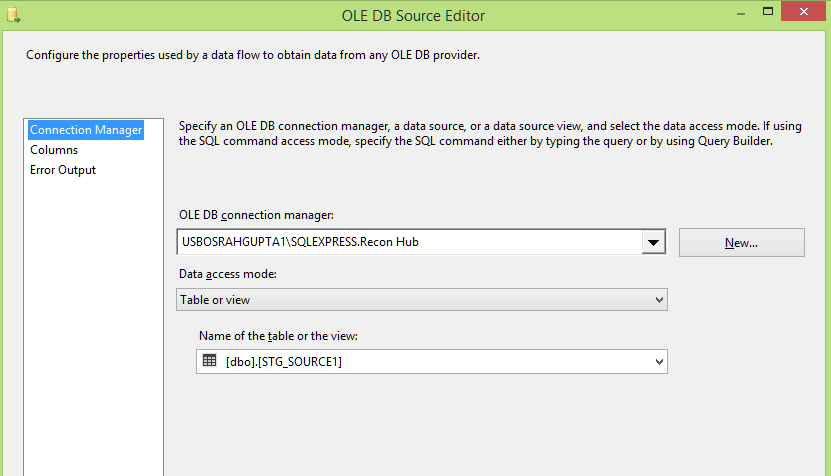
We create OLE DB Source from the Recon Hub Database. In the below we specify the name of the tables STG_SOURCE1 from which we fetch the data:
-
Sort Source 1 and Sort Source 2
We sort the source data using the sort transformation. In the sort we specify Account_id and Amount as the two fields based on which we sort the source data.
-
Merge Join
In the merge join, we do a full outer join based on the account id and amounts in the two sources. The screenshot of the merge operation is as shown below.
-
Conditional Split
Using Conditional Split, we divide the data into discrepant and not discrepant sets. We use the equal and not equal operators to compare and find the differences in amount for a given account id.
-
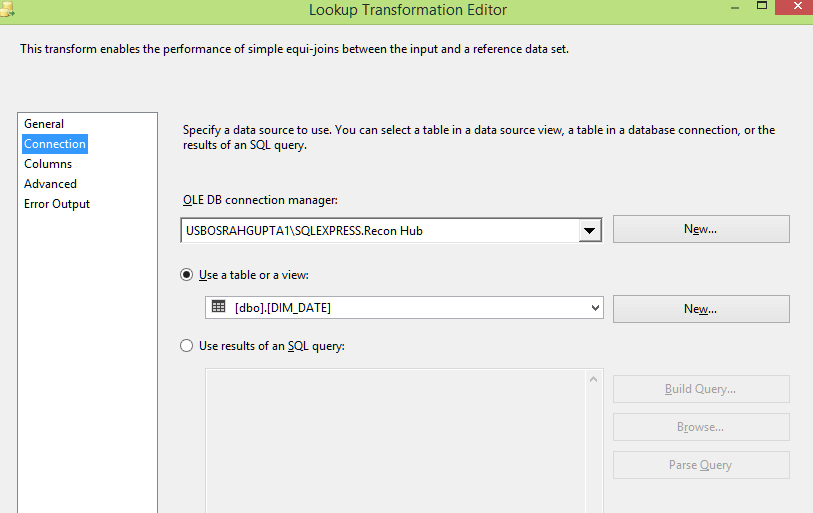
Get Date Key
In the lookup transformation we convert natural keys from source staging tables to the dimension keys by doing a lookup up into the dimensions (DIM_DATE,DIM_SOURCE,DIM_DISCREPANCY, DIM_TICKET). Create a lookup transformation, connect using OLE DB Connection Manager and Select DIM_DATE as a table to lookup as shown in the pane below:-
 Connect Date field in staging source table to DATE_VALUE in DIM_DATE to get Date Key as output:
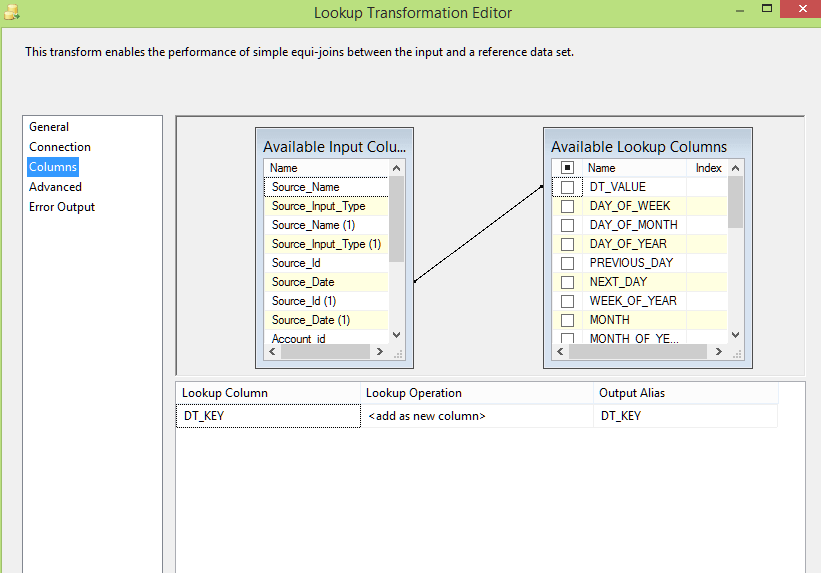
-
Get Source Key
Similar to Date Key, use the lookup to fetch the key for Source id.
-
Get Discrepancy Key
Use the lookup to fetch the key for Discrepancy id.
-
Get Ticket Key
Use the lookup to fetch the key for Ticket id.
-
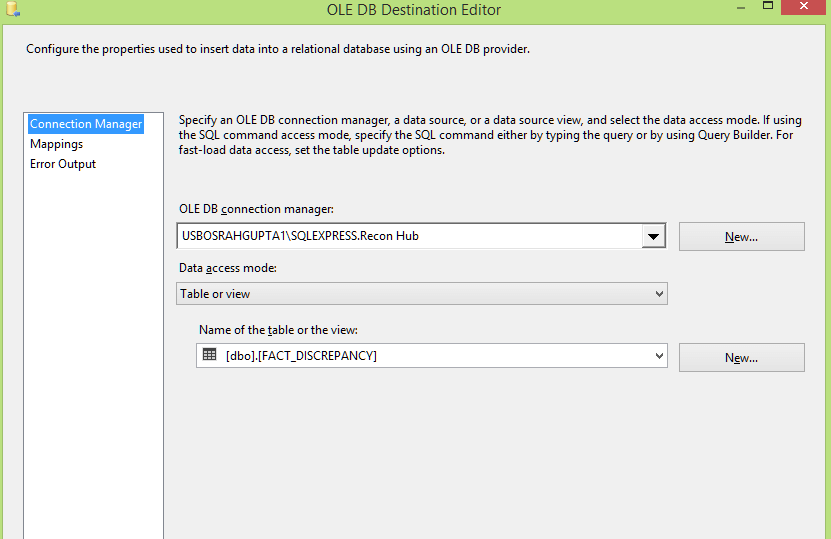
Load Fact Discrepancy
In the lookup transformation specify the target table as shown in the screenshot below:
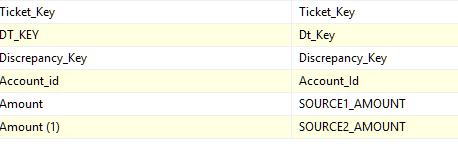
From input column to the destination, the column mapping for the Fact Discrepancy is one to one except for Amount fields which are mapped to Source1_Amount and Source2_Amount.
Summary
In this article I explained how to create a SSIS package and set up the Reconciliation Hub. The reconciliation hub can automate the manual processes of tracking discrepancies in data as it traverses different systems in an organization’s IT applications. The business of tracking and resolving data discrepancies is time-consuming and prone to human errors. By automating this and making it easier to track discrepancies and report on trends, any organization can reduce costs and improve efficiency.
Load comments