The series so far:
- Power BI Introduction: Tour of Power BI — Part 1
- Power BI Introduction: Working with Power BI Desktop — Part 2
- Power BI Introduction: Working with R Scripts in Power BI Desktop — Part 3
- Power BI Introduction: Working with Parameters in Power BI Desktop — Part 4
- Power BI Introduction: Working with SQL Server data in Power BI Desktop — Part 5
- Power BI Introduction: Power Query M Formula Language in Power BI Desktop — Part 6
- Power BI Introduction: Building Reports in Power BI Desktop — Part 7
- Power BI Introduction: Publishing Reports to the Power BI Service — Part 8
- Power BI Introduction: Visualizing SQL Server Audit Data — Part 9
Microsoft’s Power BI is not just a cloud service. It’s a suite of integrated business intelligence (BI) tools for accessing and consolidating data and then presenting it as actionable insights. If you haven’t checked out Power BI lately, you might not be aware of how aggressively Microsoft has been expanding its features and extending its reach into additional sources of data.
With Power BI, you can shape and transform data, aggregate and summarize data, apply complex calculations and conditional logic, and produce a wide range of visually rich reports that you can distribute to both internal and external users.
Power BI has, in fact, become a force to be reckoned with in the BI universe and is well worth trying out for yourself. Unfortunately, all the new and improved features, while in themselves have made Power BI a more robust offering, have also made it more difficult to understand how all the pieces fit together, a process helped little by the sometimes confusing and often obscure marketing hype.
In this article, the first in a series about Power BI, I try to make sense of the main components that are part of the Power BI ecosystem. The article takes a high-level look at these components in order to provide you with a foundation for delving into more specific details later in the series. I wrote several Simple Talk articles about Power BI back in 2015 and 2016, but much has changed this then, and this seems to be a good time to revisit the topic and fill in some of the newly added details.
Introducing Power BI
Microsoft describes Power BI as a “suite of business analytics tools that deliver insights throughout your organization.” With Power BI, you can retrieve data from hundreds of data sources, shape the data to fit your specific requirements, perform ad hoc analytics, and present the results through various types of visualizations. Power BI greatly simplifies the entire BI process, making it possible for business users and data analysists to take control of their own reporting needs, while providing enterprise-grade security and scalability.
Microsoft makes Power BI available as part of the Microsoft Business Application Platform, a somewhat confusing umbrella term that refers to several related technologies, including Power BI, PowerApps, and (according to some documentation) Microsoft Flow. You should already have a sense of what Power BI is about, but you might not be familiar with the other two. PowerApps is a point-and-click application development platform, and Microsoft Flow is a workflow and business process management platform.
For this series, we’re concerned primarily with Power BI, which provides a number of tools for delivering BI insights through browsers or mobile apps as well as embedding them within custom applications. In addition to the online service, Power BI includes Power BI Desktop, the Power BI mobile apps, the Power BI API, and Power BI Report Server. The rest of the article goes into more detail about each component.
Power BI Service
The Power BI service lies at the heart of the Power BI offering, providing a cloud-based platform for connecting to data and building reports. Users can access the service through a web-based portal that provides the tools necessary to retrieve, transform and present business data. For example, the following figure shows the portal with the Human Resources Sample dashboard selected. The dashboard includes several visualizations that are part of the Human Resources Sample report. (Microsoft provides several sample datasets, reports, and dashboards for learning about Power BI.)
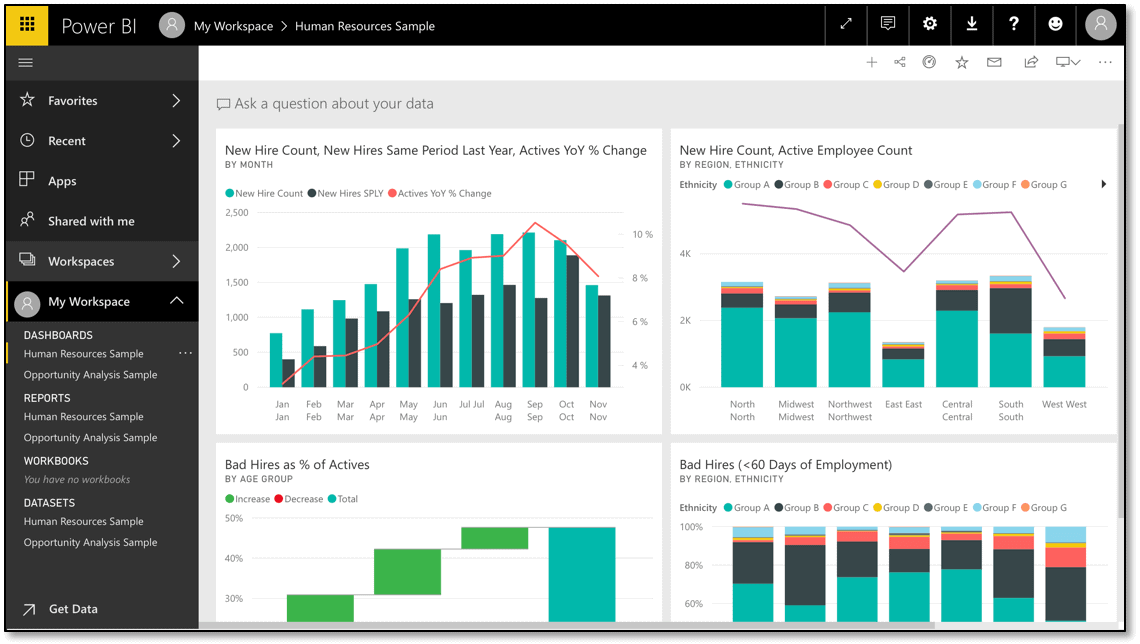
Notice that the My Workspace section in the left navigation pane is expanded, showing links to dashboards, reports, workbooks, and datasets. These four items represent the primary components that go into the Power BI presentation structure:
- Dataset: Collection of related data that you import or connect to. A dataset is similar to a database table and can be used in multiple reports, dashboards, and workspaces. You can retrieve data from files, databases, online services, or Power BI apps published by other people in your organization.
- Report: One or more pages of visualizations based on a single dataset. A report can be associated with only one workspace, but it can be associated with multiple dashboards within that workspace. You can interact with a report either in Reading view or Editing view, depending on your granted level of permissions.
- Dashboard: A presentation canvas that contains zero or more tiles or widgets. A dashboard can be associated with only one workspace, but it can display visualizations from multiple datasets or reports. You can pin an individual visualization to a tile or pin an entire report to a dashboard. If you’re a Power BI Pro or Premium subscriber, you can also share dashboards.
- Workspace: A container for datasets, reports, and dashboards. The Power BI service supports two types of workspaces: My Workspace and app workspaces, which you access through the Workspaces section in the left navigation pane. My Workspace is a personal work area provided automatically when you log into the service. Only you can access this space. An app workspace is used to share and collaborate on content. You can also use an app workspace to create, publish, and manage Power BI apps (collections of dashboards and reports).
Microsoft offers several Power BI subscription plans. At the entry level is the Power BI Free service. To register, you must use a work email account, not a personal account such as Gmail. If you try, you’ll receive a polite message denying you access. In addition, you’re limited 10 GB of storage, and you can use only the basic features, although these are actually fairly robust. For example, you can connect to all the supported data sources, clean and prepare the data, and build and publish reports. You can even embed the reports in public websites.
The next level up is the Power BI Pro service, which builds on the Free service but adds such features as sharing, collaboration, auditing, and auto-refresh. The Pro service also lets users create app workspaces. As with the Free service, Pro users are limited to 10 GB of storage; however, they can also create app workspaces that support up to 10 GB of storage each. Microsoft currently offers of a 60-day free trial of the Pro service.
The Power BI Premium subscription level builds on the Pro service, but also provides an organization with dedicated resources (capacities) for deploying Power BI at scale, with up to 100 TB of storage per capacity. In addition, an organization can distribute Power BI content to non-licensed users as well as embed content in customized applications. Plus, the Premium service includes Power BI Report Server, an on-premises solution for publishing reports in-house.
Microsoft also offers versions of the Power BI service for US government customers and European Union customers. The services are separate from the regular commercial services. Microsoft does not offer a free version of either one. (Contact Microsoft for more details.)
Power BI Desktop
Power BI Desktop is a downloadable application that Microsoft provides for free. The application is essentially a report-building tool that provides capabilities similar to the Power BI service, but kicks them up a notch. With Power BI Desktop, you can build advanced data queries and models, create sophisticated reports and visualizations, and publish the consolidated report packages to the Power BI service or Power BI Report Server.
Both conceptually and physically, Power BI Desktop can be divided into three categories, or views, for how you interact with data and create reports:
- Report view: A canvas for building and viewing reports based on the datasets defined in Data view.
- Data view: Defined datasets based on data retrieved from one or more data sources. Data view offers limited transformation features, with many more capabilities available through the Query Editor, which opens in a separate window.
- Relationships view: Identified relationships between the datasets defined in Data view. When possible, Power BI Desktop identifies the relationships automatically, but you can also define them manually.
To access any of the three views, click the applicable button in the navigation pane at the left side of the Power BI Desktop interface, shown in the following figure. In this case, Report view is selected, displaying a one-page report that includes two visualizations, one table and one bar chart.
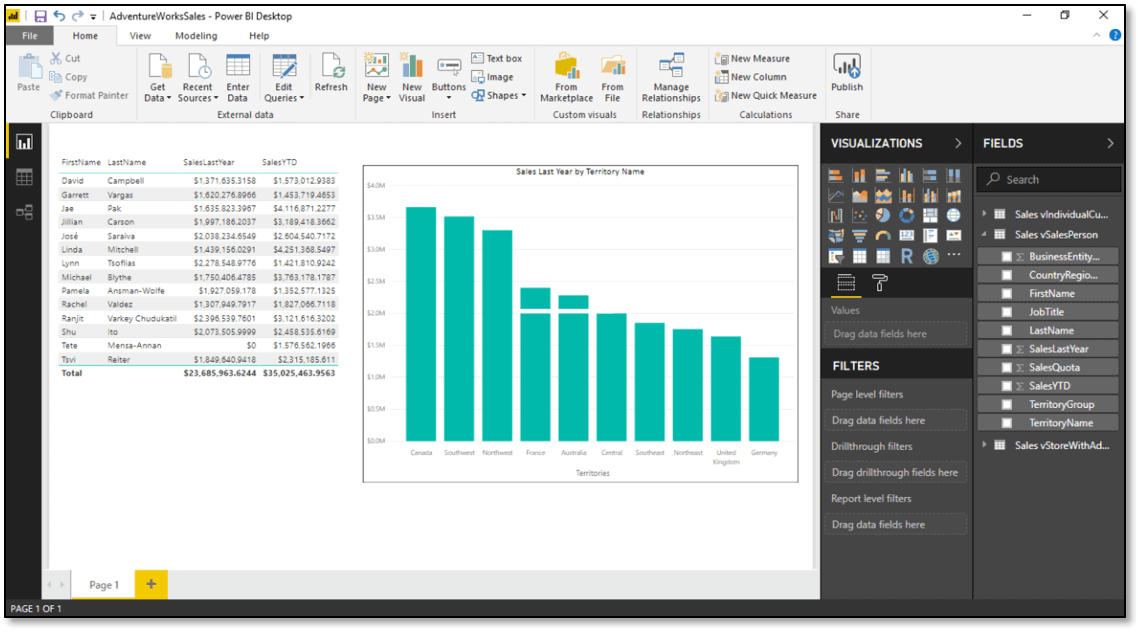
The data for the report comes from the AdventureWorks2017 sample database, running on a local instance of SQL Server 2017. However, you can define datasets based on data from a variety sources, including files such as Excel, CSV, XML, and JSON; databases such as Oracle, Access, DB2, and MySQL; and online services such as Azure, Salesforce Reports, Google Analytics, and Facebook.
Power BI Desktop also provides generic connectors for accessing data not available through the predefined connectors. For example, you can use an interface type such as ODBC, OLE DB, OData, or REST to connect to a data source, or you can run an R script and create a dataset based on the results.
Where Power BI Desktop really shines, when compared to the Power BI service, are in the features available in the Query Editor to shape and combine data, some of which are shown in the following figure. In this case, the Sales.vSalesPerson dataset is open, which is based on a view in the AdventureWorks2017 database with the same name.
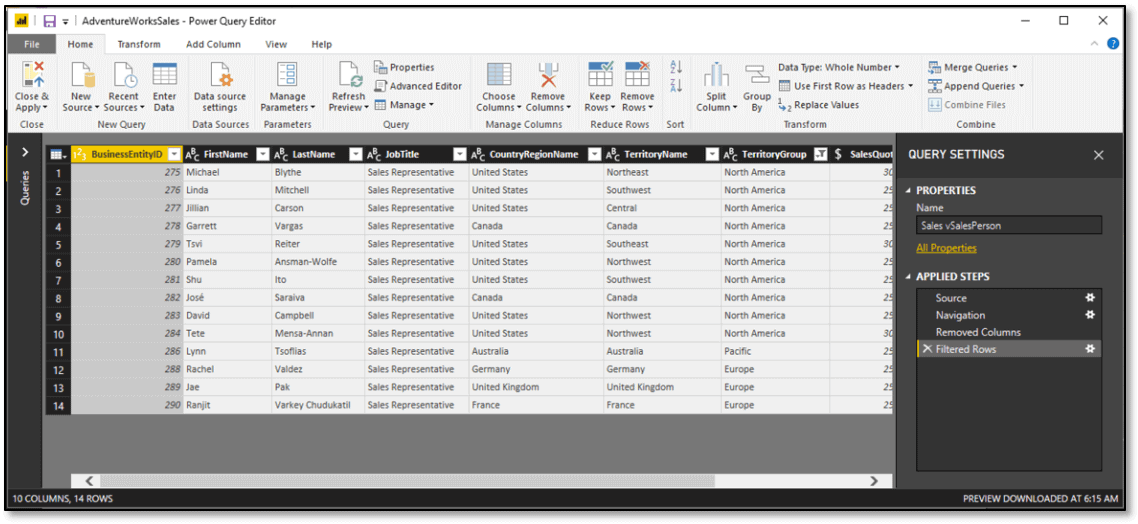
In the Query Editor, you can rename datasets or columns, filter out columns or rows, aggregate or pivot data, and shape data in numerous other ways. You can also combine datasets, even if they come from different sources. In addition, Power BI Desktop provides the Data Analysis Expressions (DAX) language for performing more complex transformations.
After you’ve gotten the data in the format you need, you can use Report view to create multiple types of visualizations, including bar chats, line charts, scatter charts, pie charts, treemaps, tables, matrices, and maps. Report view provides numerous options for configuring and refining the charts so you’re presenting the data as effectively as possible. In addition, you can import and display key performance indicators (KPIs) as well as add dynamic reference lines to visualizations to focus on important insights. Once you have your reports the way you want them, you can publish them to the Power BI service or to Power BI Report Server.
There are plenty of other features available to Power BI Desktop than what I’ve covered here, and most of them are easy to access and understand. The UI is powerful and intuitive enough to support a wide range of users, from data stewards to business users to data analysts.
Power BI Mobile Apps
Microsoft offers Power BI mobile apps for iOS, Android, and Windows mobile devices. The apps make it possible to provide specific users with access the Power BI dashboards, reports, and apps, while taking into account the form factor of the smaller devices. For example, the following figure shows the Human Resources Sample dashboard (in landscape mode), as it is rendered by the Power BI app for iPhone.
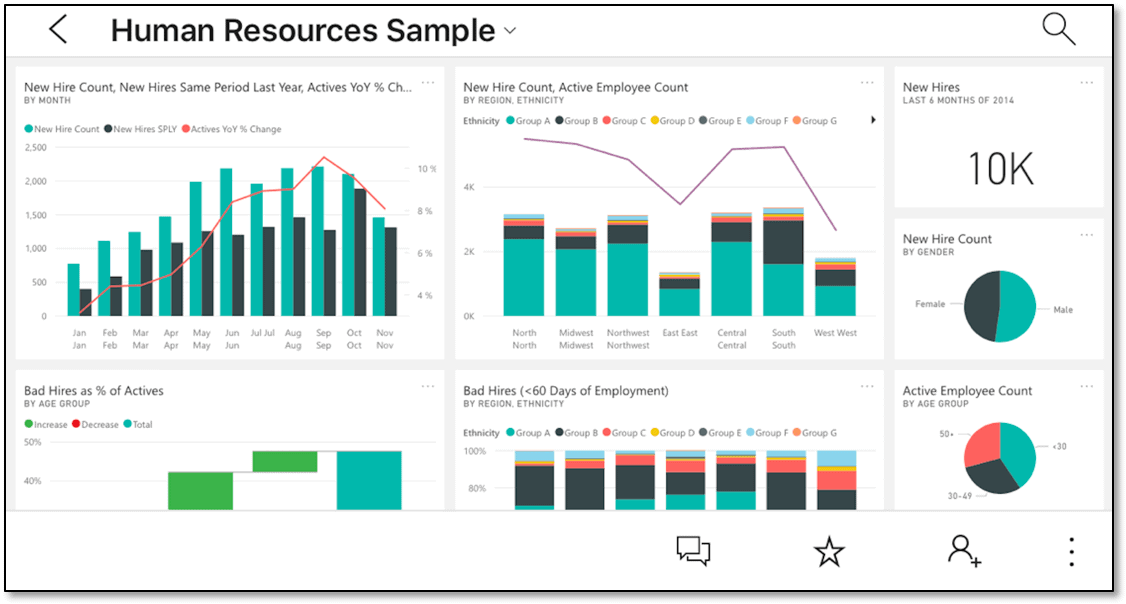
With a Power BI app, you can connect to either the Power BI service or to a Power BI Report Server instance. Because you’re dealing with an app rather than a website, you can view the Power BI content offline. Once you’re reconnected, Power BI automatically refreshes the data. When you’re connected via a 3G network, the data is refreshed every 24 hours. When you’re connected via Wi-Fi, the updates occur every two hours.
A Power BI app lets you zoom in on individual visualizations, add annotations, and share snapshots of a report or visualization. You can also filter content by owner, search content, or tag content as favorites. With a Power BI Pro or Premium license, you can share a link with colleagues so they can view your dashboards. There are plenty of other features as well, and since the apps are free, there’s no reason not to try one out, as long as you’re signed up for the Power BI service.
When you’re creating Power BI reports, you can optimize them for mobile devices. This causes Power BI to add features to the reports specific to mobile usage, such as allowing users to drill down into visualizations. In addition, you can add slicers to your reports that let users filter the displayed data. Plus, you can create a QR code for a report and distribute it to colleagues, who can then scan the code from within their Power BI app to view the report.
Although the mobile apps are similar from one platform to the next, there are some differences. For example, only the iOS and Android apps let users annotate visualizations, share snapshots, or view a report via a QR code. Despite these differences, the main functionality is the basically the same from one platform to the next, allowing users to view a wide range of information, no matter where they’re working or how they’re connected.
Organizations that use Microsoft Intune to manage mobile devices can also use the service for managing the Power BI mobile apps. By configuring the necessary policies, administrators can control how data is handled and when application data should be encrypted.
Power BI API
Microsoft offers development teams a REST API that provides programmatic access to Power BI resources. Developers can use the API with any programming language that supports REST calls.
One of the most important capabilities that the API supports is the ability to embed reports, tiles, and dashboards into customized applications. The reports are fully interactive and are automatically refreshed whenever the data changes. Depending on the organization’s subscription level, developers can embed components into applications for internal users who are licensed for Power BI or for users who do not have Power BI accounts.
Another option for developers using the API is the ability to create customized visualizations that can be used in Power BI reports. Customized visualizations are written in TypeScript, a JavaScript superset that Microsoft developed for large-scale JavaScript applications. The visualizations also incorporate cascading style sheets (CSS) and support such features as variables, nesting, mixins, loops, and conditional logic.
Developers can also use the Power BI API to push data into a dataset. In this way, they can extend their business workflows to the Power BI environment. Any reports or dashboards that incorporate the dataset are automatically updated to reflect the new data.
Power BI Report Server
One of the newer tools in the Power BI arsenal is Power BI Report Server, an on-premises solution for creating, deploying and managing Power BI reports. The product is included with a Power BI Premium subscription to provide customers with a tool for delivering reports from within their own data centers. Users, in turn, can view the reports via their browsers or Power BI mobile apps or as email attachments.
If you choose to install Power BI Report Server, you must use the Report Server Configuration Manager to specify such settings as the service account, web service URL, SQL Server database, and web portal URL, as shown in the following figure. You need to set up your configurations before you can start working with the actual reports.
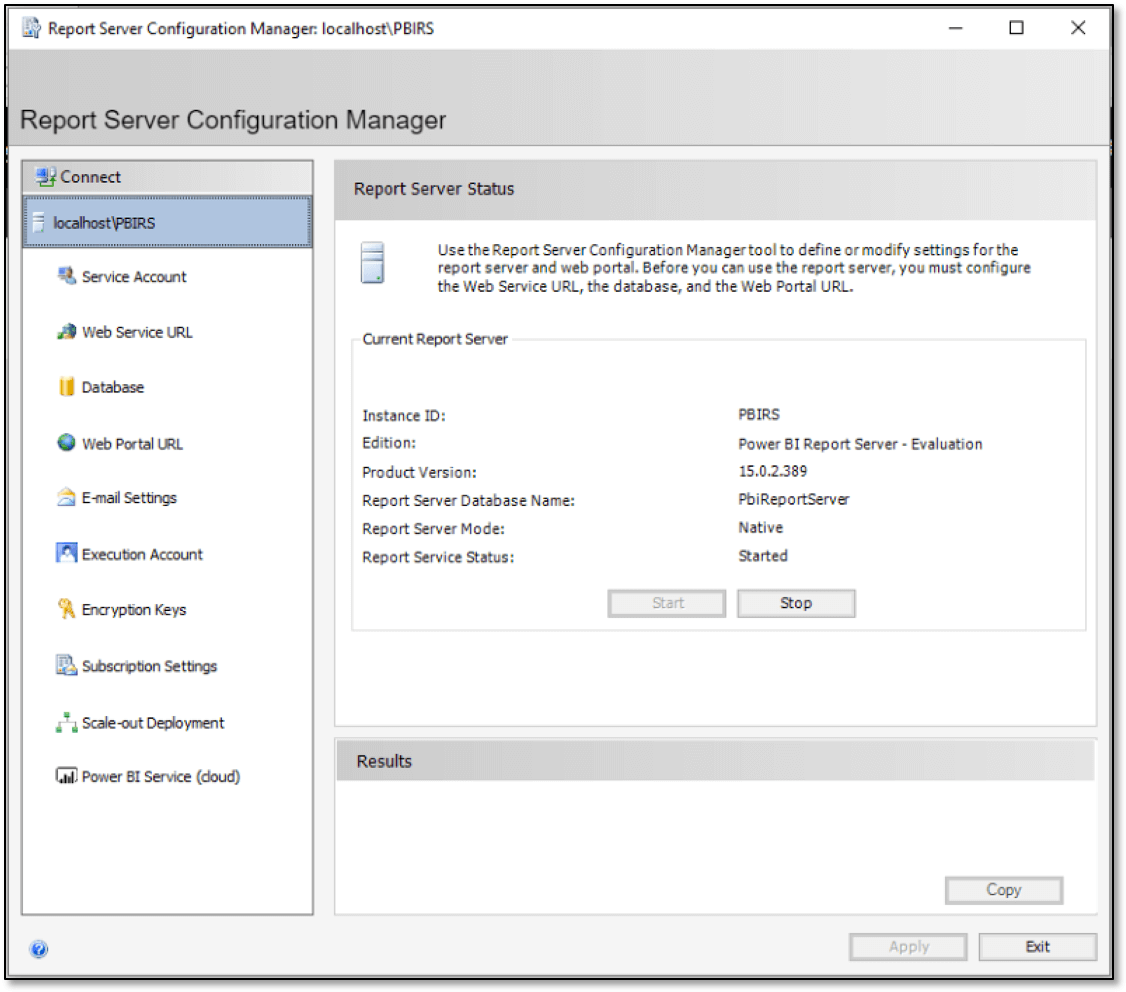
The Report Server Configuration Manager is included in the Power BI Report Server installation, but it is separate from the tools you use to manage the reports. For report management, you must use the Report Server web portal, which is enabled after you configure the necessary settings. Through the web portal, you can access all your reports and KPIs, as well as carry out such tasks as schedule data updates or subscribe to published reports.
Like the Power BI service, Power BI Report Server works in conjunction with Power BI Desktop. You can create reports and then save them to Power BI Report Server. For example, you can save a report such as the one shown in the following figure to Power BI Report Server.
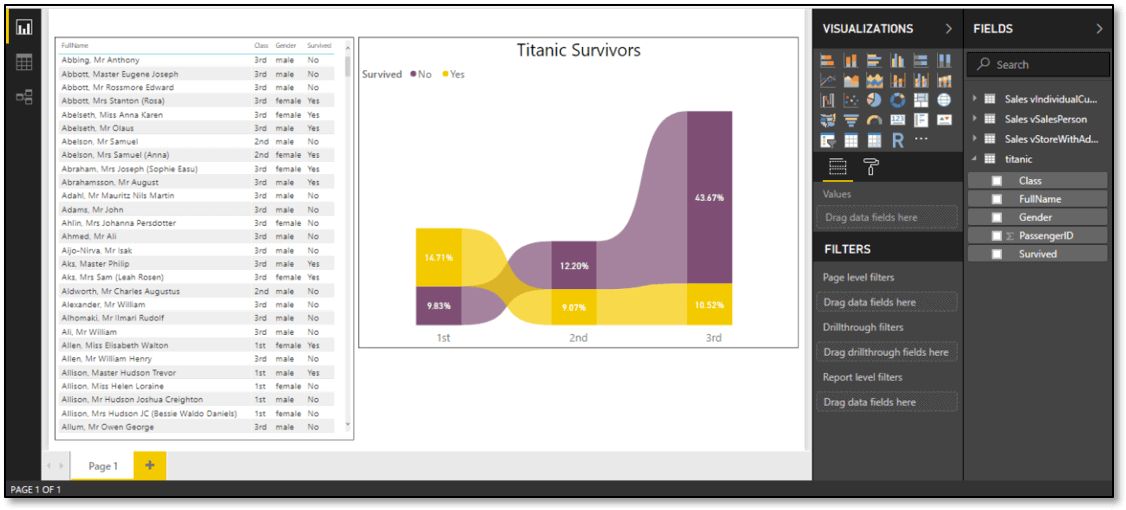
The report is based on data from the Titanic dataset, available as a CSV file from the site https://vincentarelbundock.github.io/Rdatasets/datasets.html. The report includes one table and one ribbon visualization. To save the report to Power BI Report Server, you must use the Save As command and provide the web portal URL.
When you connect to the Power BI Report Server web portal, you’re taken to your Home page, which lists any reports you’ve added to the server. For example, the following figure shows the two reports I added on my system: AdventureWorksSales and Titanic. I had created both of these reports in Power BI Desktop.
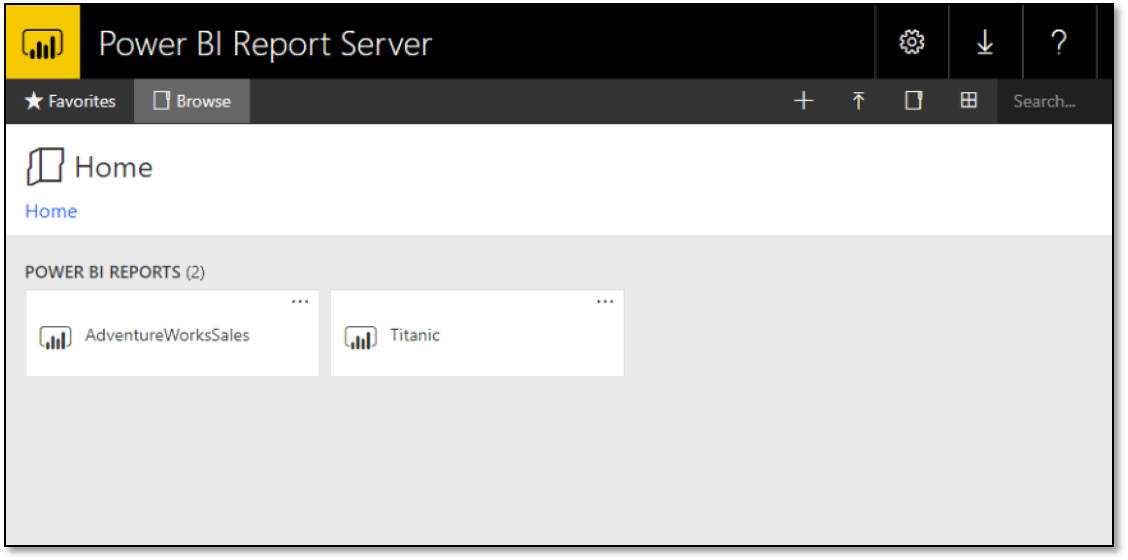
To view the Titanic report, click the applicable report icon. This takes you to the report page shown in the following figure.
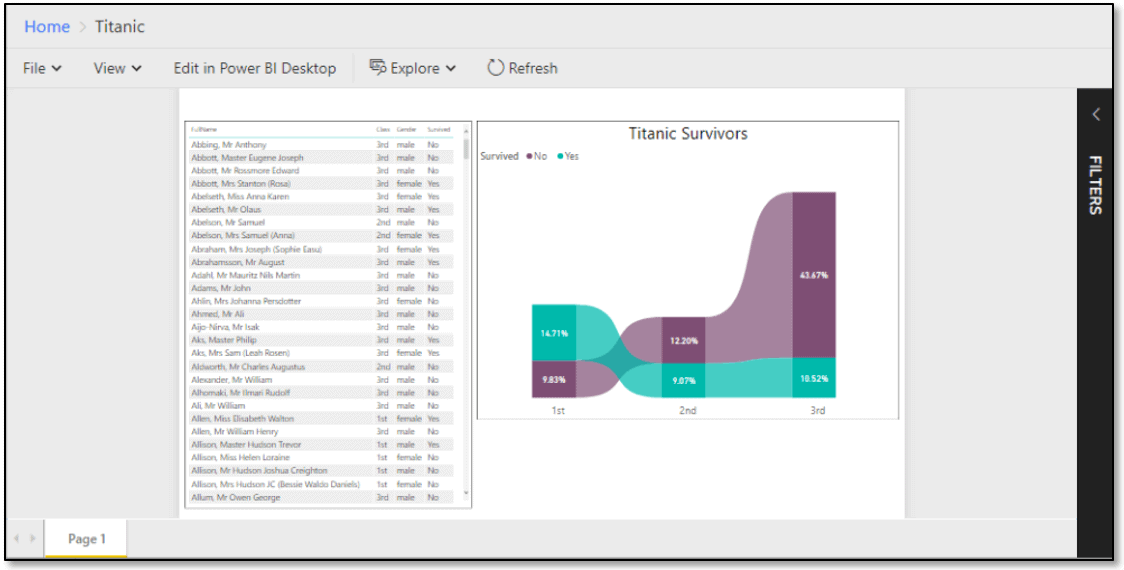
Notice that the report looks similar to what we saw in Power BI Desktop, although the colors are a bit different from the original. Even so, this should give you an idea of how Power BI Report Server works and how easy it is to copy your reports from Power BI Desktop to Power BI Report Server.
Keep in mind, however, that Power BI Report Server is still a young product and, as such, you might run into some odd behavior along with way. For example, if you install the product on a standalone server that is not part of a domain, you might have trouble viewing reports in the Edge browser. Worse still, the error messages you receive might send you down a rabbit hole that can waste much of your time (as it did me). However, the Chrome browser appears to work fine for viewing reports in Power BI Report Server, and I’ve also read that running Internet Explorer as an administrator can get the reports to render properly.
Another problem you might run into has to do with the Power BI Desktop version that you’re using. You must use one that’s optimized for Power BI Report Server, which is not always the most current release. This can be problematic if you create reports in a newer version of Power BI Desktop and then discover you have to revert back to an older version to save the reports to Report Server. The older version of Power BI Desktop might not be able to properly process the report files. Last I checked, the most recent Power BI Desktop release was April 2018, but Power BI Report Server required a March 2018 release of Power BI Desktop.
I’ve no doubt that, with time, Microsoft will get many of these bugs worked out and will be adding new features along the way. It will be interesting to see what Power BI Report Server looks like a year from now, or even over the next six months.
More to Come
As Power BI continues to evolve and grow, new features will continue to come online, as well as services related to the Power BI ecosystem. For example, Microsoft now offers Power BI Embedded, a service for ISVs and developers looking for an easier way to embed Power BI analytics into their applications. Microsoft also now provides features for better integrating Excel and Power BI. In addition, Microsoft will soon be offering insights, line-of-business apps that apply advanced intelligence to data for better understanding that data. Two insight apps—Power BI for Sales Insights and Power BI for Service Insights—are expected to preview in the very near future. What will come after that is anyone’s guess.
Load comments