When you think about reporting, two tools come to mind: SQL Server Reporting Services (SSRS) and Power BI. SSRS is an excellent choice for detailed, line item style reporting or reports with some basic graphs. You may have heard of this style as paginated reports in SQL Server 2016. At the other end of the spectrum is Power BI, an outstanding tool for creating self service analytic dashboards.
But what about the middle ground? What about the user who wants a higher-level view of their data than normally found on an SSRS report, but has no desire or time to generate their own dashboards with Power BI? This is where Mobile Report Publisher comes to the rescue!
Don’t be misled by the name. Mobile Report Publisher isn’t just for creating reports on mobile devices such as phones and tablets, although it does that well. It can be used to create beautiful, functional, and useful dashboards for the web. Because Mobile Report Publisher renders all its reports in HTML5, the reports look the same whether you are using Edge on a Windows computer, Firefox on Linux, or Safari on a Mac or even an iPad!
Mobile Report Publisher operates within the framework of SQL Server Reporting Services, so you’ll need an SSRS 2016 (or later) server to be able to use it. Sorry those of you on older versions of SQL Server, but this will at least give you another reason to get your boss to upgrade!
Of course, we’ll need some data to report from as well, so for this article we’ll be using the WideWorldImportersDW sample database. This is the data warehouse version of the new Wide World Imports sample introduced with SQL Server 2016. You can download the database backup, or download the source code and build the database yourself.
One way that Mobile Reports can get the data is through Excel spreadsheets. Mostly likely, you’ll want to see data from a database. To access that data, data sources and datasets must be set up in SSRS. Before we begin creating reports, let’s set up the data source and datasets in the SSRS report portal.
Data Sources
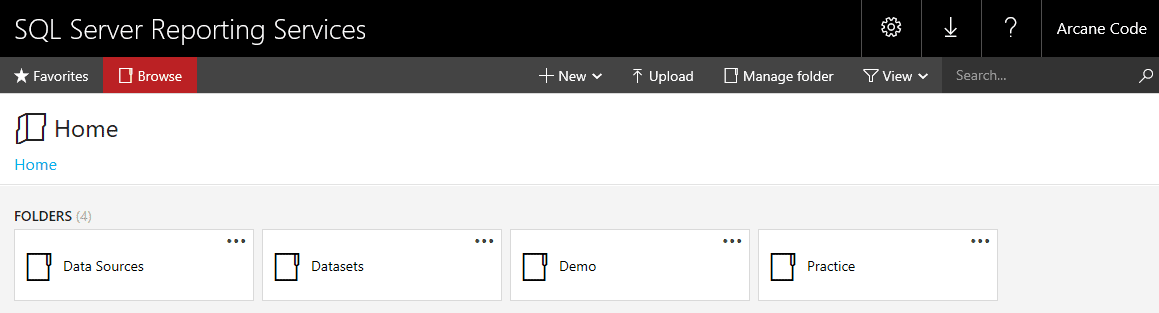
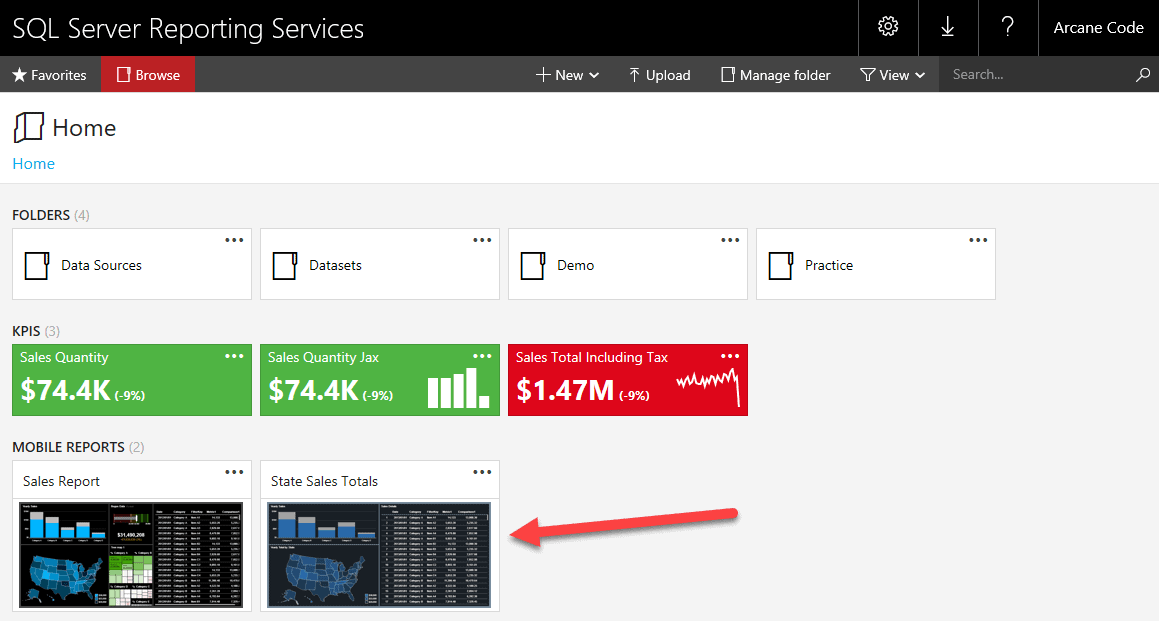
The first step is to create a data source. Most folks have folders setup within their Reporting Services portal for things like data sources and datasets as you can see in this next screen shot from my system.
If you’ve worked with SSRS before, you’ve likely used data sources and datasets already, but briefly you’ll first need to create a data source to connect to the WideWorldImportersDW database.
- Navigate to the Data Sources folder (or create one if it doesn’t exist).
- Click the New button in the toolbar (shown above in about the middle of the image).
- From its menu, pick Data Source.
- For the name, enter WideWorldImportersDW.
- For the Connection Type, pick Microsoft SQL Server.
- You’ll next enter the connection string. If you need help, there is a handy Learn more link beside the Connection String title that has a lot of great information. For this article we’re accessing SSRS from the same computer it is running on, so we can use localhost. Therefore the connection string reads:
Data Source=localhost;Initial Catalog=WideWorldImportersDW - For credentials you have two basic choices. As the user viewing the report is a great option if you have authentication (Active Directory, Kerberos) setup correctly, or you are running your reports on the same computer as SSRS (i.e. localhost). If you are going to be running the report unattended, or you are on a system such as a development box you can also pick Using the following credentials and enter your (or an appropriate) user id and password.
- Always be sure to click the Test connection button to ensure everything works.
- Click Create to apply the new Data Source to the server.
Datasets
With your data source setup, you can now create your datasets. You can think of a dataset as a query that is saved for others to easily use. In this case it will be a SQL query, but had a different data source been used, such as SSAS (SQL Server Analysis Services), it might be an MDX or DAX query. There are two utilities that can be used to create a dataset, Visual Studio and Report Builder. As Report Builder is a bit simpler, we’ll use it for this article.
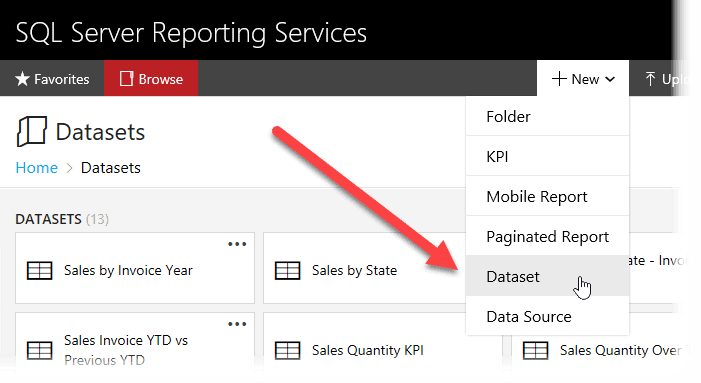
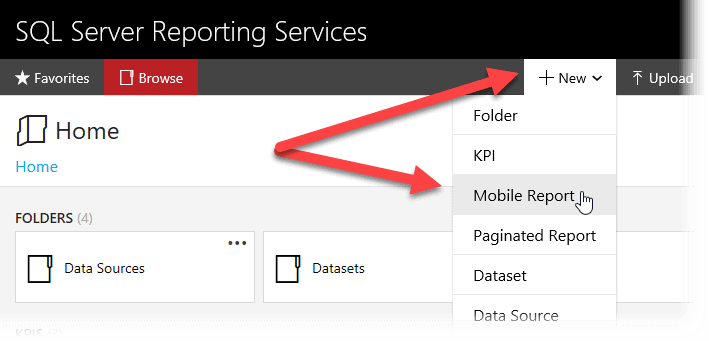
Inside the report portal, click New, then in the drop-down menu select Dataset.
When you do, you’ll get a dialog that SSRS is attempting to open the Report Builder app. If you don’t have Report Builder, there is a big Get Report Builder button you can use to download it. If you already have it installed, and are in Microsoft Edge, you’ll get a second dialog asking Did you mean to switch apps? This is a safety feature of Edge, in this case we can just say Yes.
When Report Builder opens, it comes to the first step in creating a dataset. On this window you’ll have to select the shared data source for your dataset.
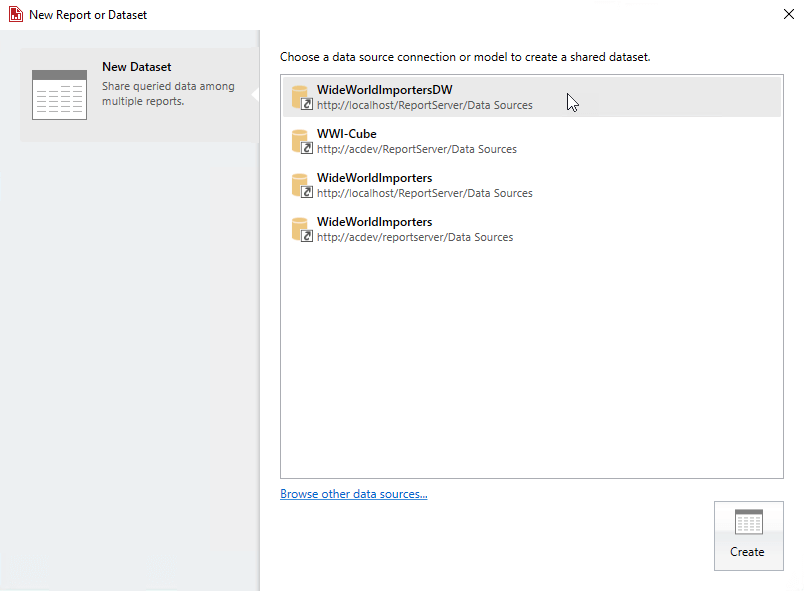
If you have used Report Builder before, it will remember the previously selected data sources and list them, as you can see above. If the data source you want isn’t listed, but is already on your SSRS server, you can click on the Browse other data sources link to find and add it to the list. Once it is in the list, click on it, then click the Create button in the lower right.
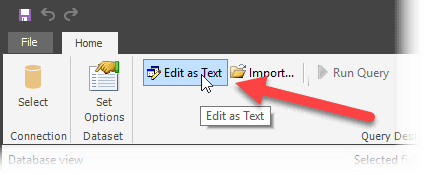
Once the data source is selected, Report Builder opens to a dataset designer which will allow users to navigate a tree, select fields, create filters, and the like. This is meant for business users who are not familiar with the syntax of SQL. If you are though, you can take a short cut and enter SQL directly into the dataset designer. Simply click the Edit as Text button in the toolbar.
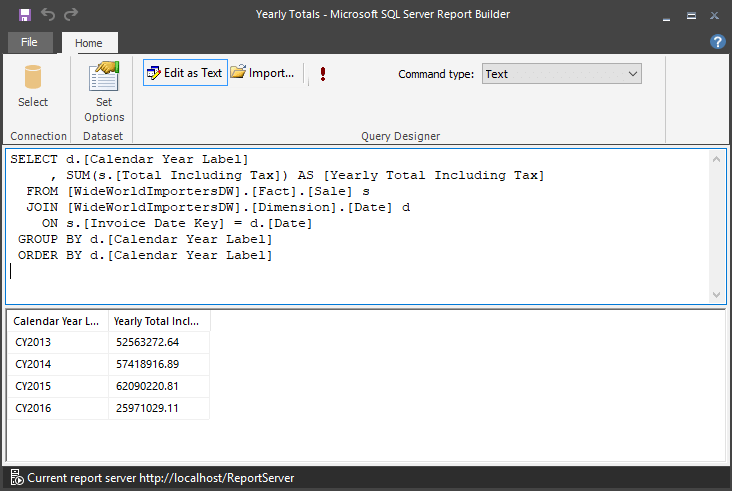
It’s likely that, as part of your routine, you’ll have developed the query you wish to use in a tool such as SSMS (SQL Server Management Studio) or the new SQL Server Operations Studio (see the article A Walk Around SQL Operations Studio for more info on this tool). That’s what was done here, so just paste the already tested query below into the Query Designer in Report Builder.
|
1 2 3 4 5 6 7 |
SELECT d.[Calendar Year Label] , SUM(s.[Total Including Tax]) AS [Yearly Total Including Tax] FROM [WideWorldImportersDW].[Fact].[Sale] s JOIN [WideWorldImportersDW].[Dimension].[Date] d ON s.[Invoice Date Key] = d.[Date] GROUP BY d.[Calendar Year Label] ORDER BY d.[Calendar Year Label] |
It’s a good idea to test within Report Builder to ensure the query still functions as expected, so click the red exclamation mark at the top. The grid at the bottom should then populate with data.
Yea! It worked! Now it can be saved; just use File, Save or click the floppy disk icon in the upper left. You’ll need to save it to the server, so if the Look in: area at the top doesn’t already read the name of your server, use the Recent Sites and Servers button to navigate to the server. Then on the server navigate to the Datasets folder, or a similar folder where you wish to store it.
Name this dataset Yearly Totals.rsd and click OK to save it.
For the report we will be generating, a second dataset will be needed. If you closed report builder just refollow the steps above. On the other hand, if Report Builder is still open simply click File, New. In the New Report or Dataset window, click New Dataset. From here, just follow the same steps you’ve already done.
In either case, use the code below for the new datasets query.
|
1 2 3 4 5 6 7 8 9 10 |
SELECT d.[Calendar Year Label] , c.[State Province] , SUM(s.[Total Including Tax]) AS [Yearly State Total Including Tax] FROM [WideWorldImportersDW].[Fact].[Sale] s JOIN [WideWorldImportersDW].[Dimension].[Date] d ON s.[Invoice Date Key] = d.[Date] JOIN [WideWorldImportersDW].[Dimension].[City] c ON s.[City Key] = c.[City Key] GROUP BY d.[Calendar Year Label], c.[State Province] ORDER BY d.[Calendar Year Label], c.[State Province] |
Save the dataset as Yearly Totals by State.rsd. You can now close Report Builder.
Installing the Mobile Report Publisher
Now that the groundwork has been laid, it’s finally time to start generating a mobile report. To do so, we’ll need to get the Mobile Report Publisher tool installed. In the SQL Server Reporting Services Report Portal, go to the New menu, then click on Mobile Report.
When you do, you are prompted that SSRS is opening Mobile Report Publisher. If you don’t have Mobile Report Publisher already installed, there is a button you can click, Get Mobile Report Publisher, that will take you to a webpage where you can download and install.
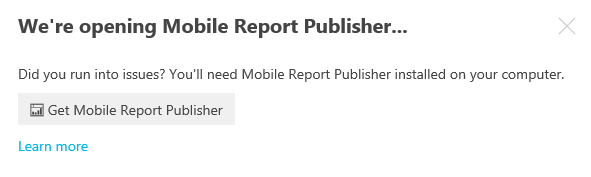
If you’ve not installed Mobile Report Publisher, go ahead and do so now. It’s a free download from Microsoft. Once it is installed, and you only have to install it once, then you can simply close this window once it is open.
If you are using Microsoft Edge to view your SSRS portal, you will get an additional security prompt.
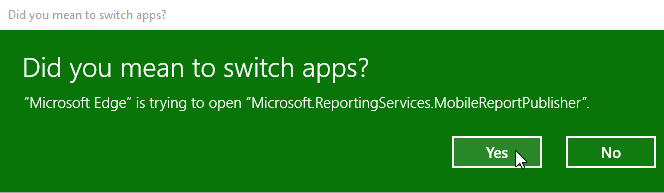
Simply click Yes to launch Mobile Report Publisher.
Alternatively, you could first install the tool without going through the New step. In the top of the report portal, on the right side is a down arrow. This is the download menu, clicking it will bring you to the various sites to install SQL Server Reporting Services tools. Also, once Mobile Report Publisher is installed it isn’t necessary to go through the SSRS portal to open it; you can simply use the Windows menus to launch it.
Designing the report
When Mobile Report Publisher opens, it first needs a connection to a SSRS server. In the dialog that appears, simply fill out the required information and click Connect.
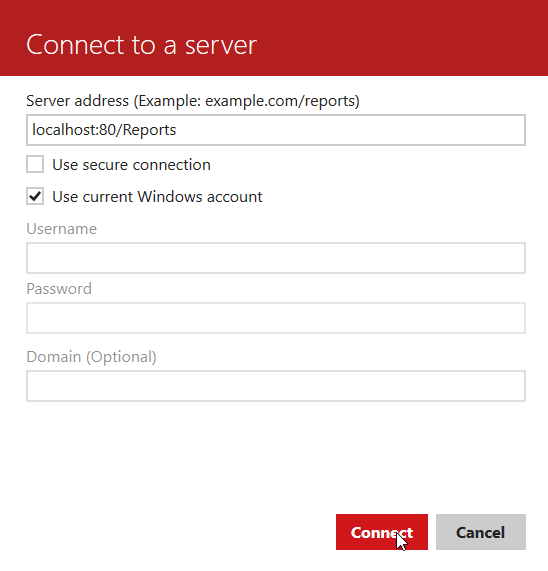
The computer used in writing this article is a virtual machine with both SSRS and Mobile Report Publisher installed, so for the server name we can use localhost. Alternatively, we could use the real computer name hosting SSRS.
As this is just a virtual machine setup for this article, similar to using your home computer, no authentication was created, so Use secure connection is unchecked. If you are in your enterprise where you are using Active Directory, it is likely you will need to check this on.
If you wish the users of the report to connect using their credentials, leave the Use current Windows account checked on, otherwise enter the credentials you wish to use to run the report. When done, just click Connect.
The Designer
Let’s take a look now at the designer. To make discussion easier, sections of the designer have been outlined in various colors.
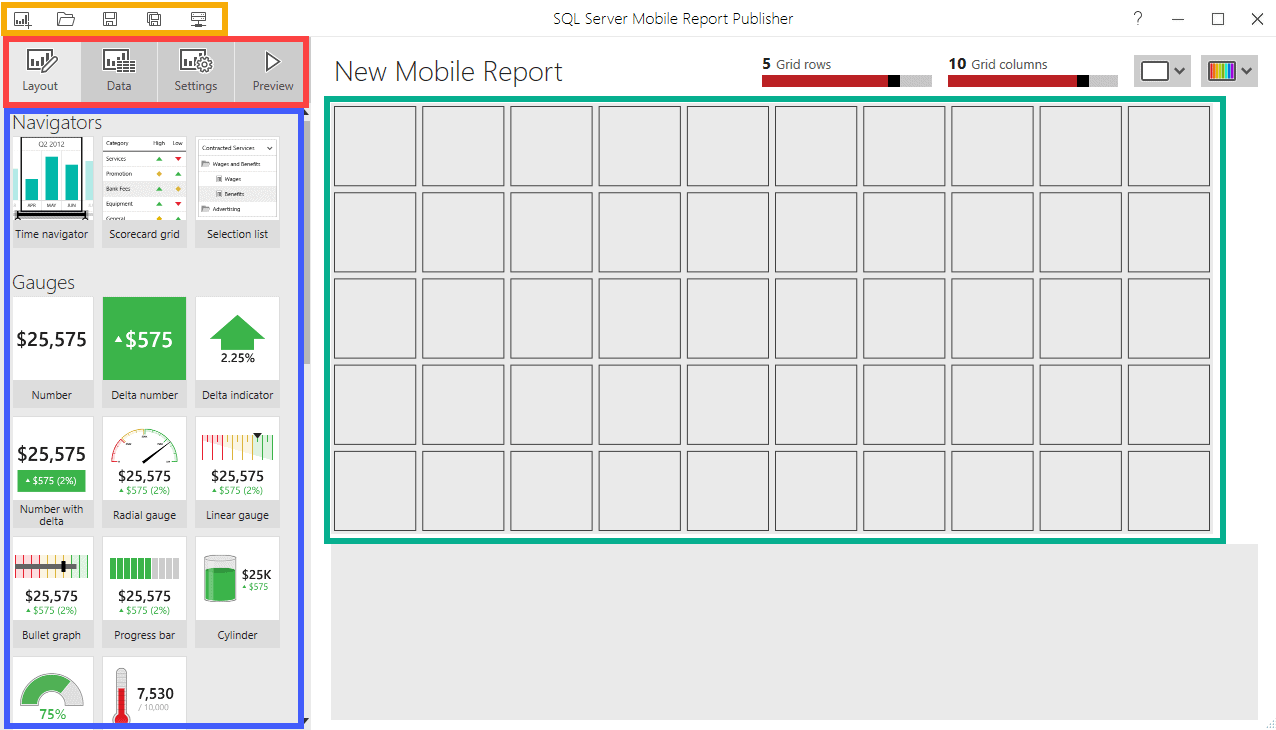
On the top left, highlighted in red, are four buttons that control the designer. In the image above, the Layout is being displayed. In Layout mode, under the buttons are various report elements that can be dragged and dropped into the design area, highlighted in green to the right. In addition to Navigators and Gauges, scrolling down will reveal Charts, Maps, and Data grids.
Above the green design area is the report name, which defaults to New Mobile Report. Simply click in there to change the report title. Next to it are sliders which control how many grid rows and columns appear. For this report just use the defaults.
To the right of the row / column sliders are two drop downs. These control the layout configuration (Web, Tablet, or Mobile) and color scheme. Those will be explored in a bit. Under the grid of rows and columns is a big blank gray box. This will hold the properties for the various components that will be placed on the report, you’ll see those appear as we begin creating the report.
Before we begin, though, there’s one more area to point out, highlighted in gold in the upper left. These are simply the file handling icons, from left to right New, Open, Save, Save as, and Server Connections. The first four are obvious, the last one simply allows you to alter the connection information to the server that you entered when you first opened Mobile Report Publisher. This is useful for developing on a local machine, then later changing to a production server.
Creating A Report
Now that you are familiar with the Layout mode of the designer, let’s begin creating a report. In the report elements area (highlighted in blue) scroll down to the Charts area. Find the Category chart, drag and drop it into the layout area in the very upper left square.
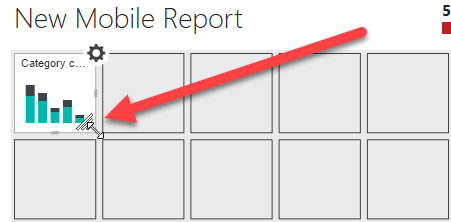
After doing so, you’ll note a sizing handle. Clicking on it, drag until the chart takes up an area five boxes wide by two boxes high.
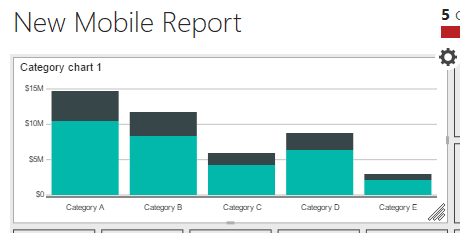
In the area under the layout configuration is the properties for this chart. Click in the title area, and change the title from the default of Category chart 1, to Yearly Sales.
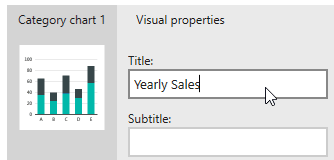
Note that once you tab out of the Title property box, the title over the left side of the chart will update as well.
Next add a map. Scroll down to the Maps area in the report elements area, click on the Gradient heat map, and drag and drop it into the square on the very left just under the chart. Expand it to be three rows high by five wide. In the properties area at the bottom, change the Title to Yearly Total by State.
While in the properties, scroll to the right. The default map is USA, but clicking the Map dropdown will allow you to pick from other maps, or use a custom map. The Value direction area lets you set whether larger numbers are better, or smaller numbers. Leave these at the defaults, but just know they are there when you begin to create you own reports.
Finally, let’s add one last report element. In the Data grids area, move a Simple data grid onto the configuration area. Place it in the blank square in the upper left, and expand to take up the remaining space. In the properties area, change the Title to Sales Details. Your designer should now resemble the following image:
In the button area, click Preview to see your report.
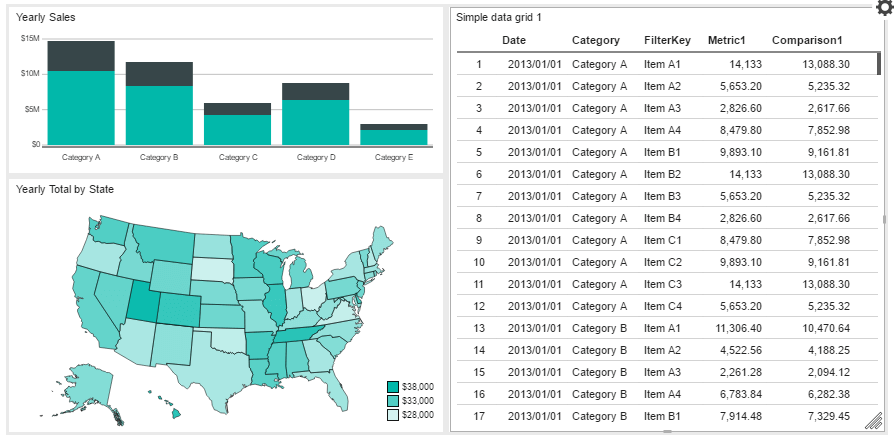
The preview shows not just the layout, but populates the various components with data. The Sales Details area can be scrolled up and down to look at values. But where did it get the data from?
Data? What data?
Click the arrow to the left of the report title (New Mobile Report in the previous image) to return to the designer. The next step is to add real data to the report. Click on the Data button in the button bar.
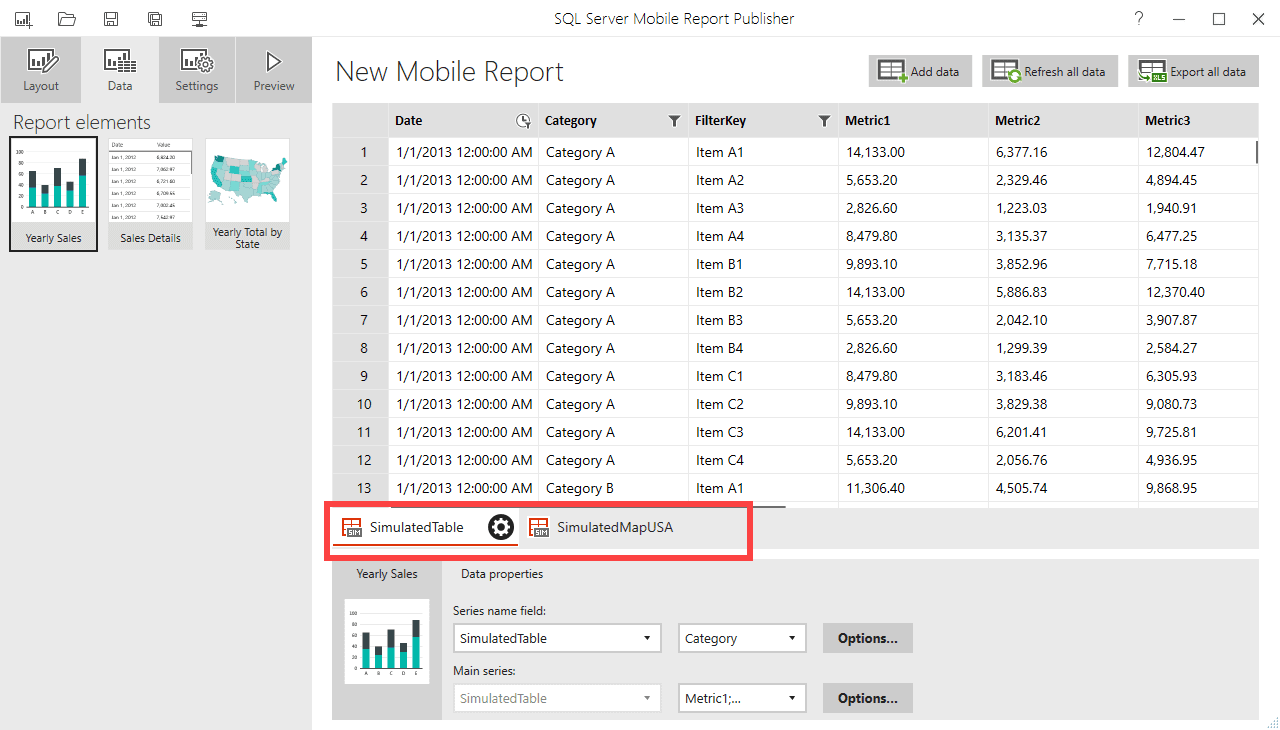
The main area shows the data for each dataset. Datasets can be selected by using the lower tabs (highlighted in red in the above image). The properties pane on the bottom is used to tie each report element, on the left, to a dataset. To change the dataset for a report element, simply click on an element in the elements pane on the left. Then in the properties area the various data properties can be set.
Right now, the data area is showing sample data. Each report element contains a sample dataset of its own. This allows you to get a realistic feeling of how the report will look like. It’s time now to add some real data.
Click on the Add data button on the top right. You will then be prompted for the source, Excel or a Report server. We went to a lot of effort earlier in this article to setup datasets on our report server, so that’s the option to select here. Next, you will be show a list of servers the report knows about. It got these from the options you selected when initially creating the report. If you don’t see a server you need, simply cancel, then use the Server Connections button to add another server. Then return to add data. Assuming your server is listed, just click on it.
The next screen shows you a list of datasets in the last folder you accessed on the report server.
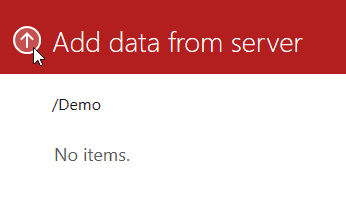
In this example, Mobile Report Publisher defaults to the last folder that was accessed, in this case Demo, but it has no datasets in it. Just use the up arrow to return to the folder above it until you get to the root folder.
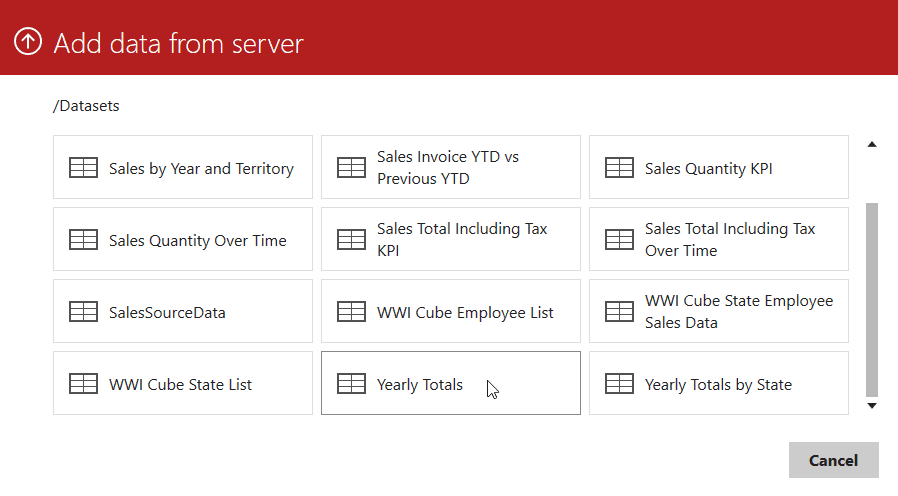
On this server, all the datasets are stored in a folder name Datasets, so once it was clicked on we see a list of all our datasets. All that is needed is to scroll down the list of datasets and pick Yearly Totals.
The new data now appears as a tab in our report data area.
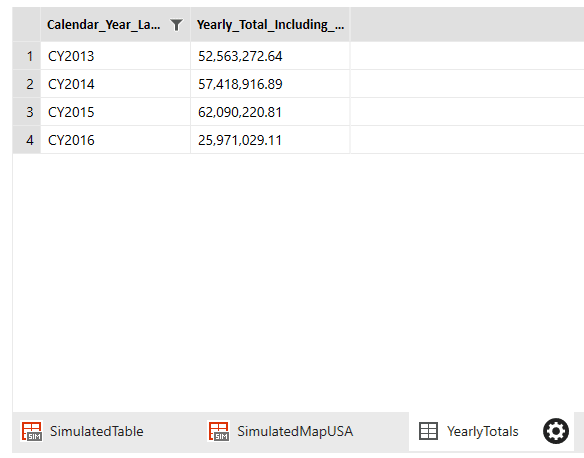
You can view the data, but cannot change it. Also notice the icons to the left of the tab names. Simulated datasets have red icons, whereas imported datasets have black ones, providing visual cues as to the source of the data.
Next, repeat the steps above to add the Yearly Totals by State dataset from the report server.
Datasets and Report Elements – Better Together!
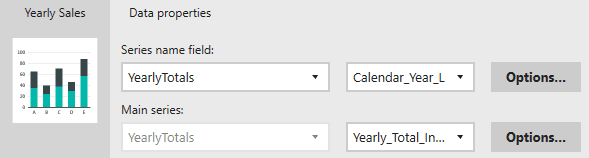
The next step is to tie the existing report elements to the new datasets. Start by clicking the Yearly Sales report element on the left. Then in the properties area at the bottom, use the dropdown to change the Series name field to YearlyTotals. The drop down to the right indicates the series to use, in this graph what should each bar in the chart represent. For this example, ensure it is set to Calendar_Year_Label. It should be noted, Mobile Report Publisher doesn’t handle spaces well. In dataset names, it simply strips out any spaces it finds, for field names it replaces spaces with an underscore.
The Main series area are the values that will be plotted. Simply validate it is set to Yearly_Total_Including_Tax.
Next, click on the Sales Details report element on the left. In the data properties area, change the Data for the grid view to YearlyTotalsbyState. To the right is the Data grid columns pane. In here, you can clean up the titles of the columns; these are the labels that will be presented to the user. You may also uncheck a column to prevent it from appearing. Finally, you may also use the ‘hamburger’ icons (the stack of horizontal bars to the left of the check boxes) to rearrange the columns. Simply click and hold on the icon then drag it up and down to rearrange the order.
Take a moment to clean up the titles that will be shown to the end user. For this sample, change it to Year, State, and Total Including Tax, as shown below.
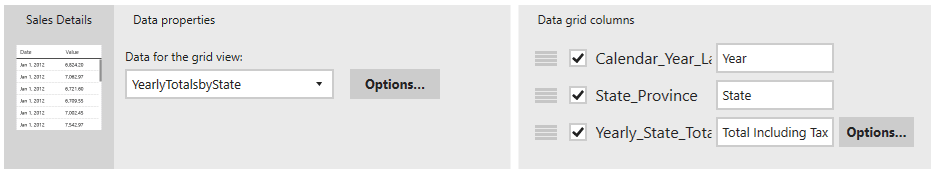
As the last item for the data grid, click on the options button beside the bottom total column. In the pop up window that appears, change the String format property to Currency.
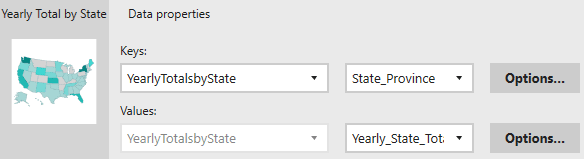
Finally, we’ll set the map properties. Click on the Yearly Total by State map in the report elements area. Change the Keys to YearlyTotalsbyState so it knows which dataset to use. To the right is a drop down that indicates the key to use for geography. This needs to be the name or abbreviation of a state, country, or some other similar geographic key. As this dataset has the State_Province column, select it in the drop down. The values can be left at the Yearly_State_Total_Including_Tax.
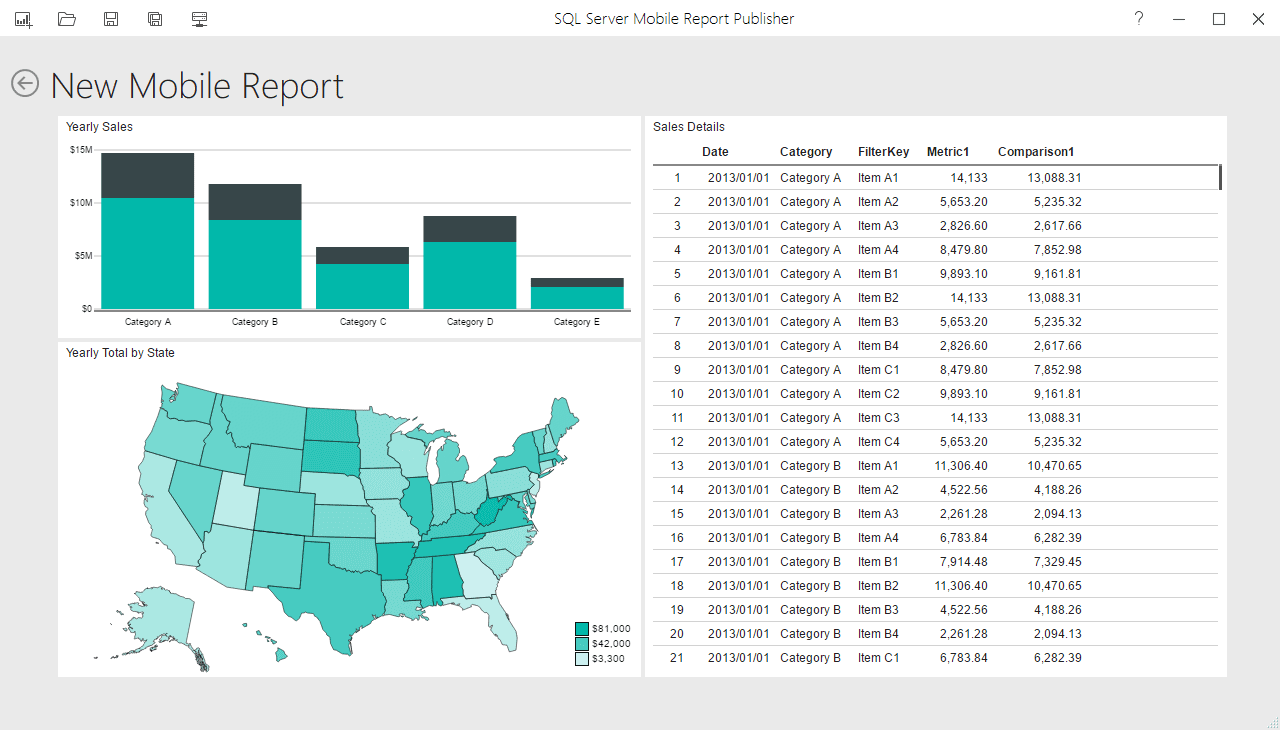
As a last step before we preview, click in the New Mobile Report title at the top. Change the value to State Sales Totals. Now you can click the Preview button.
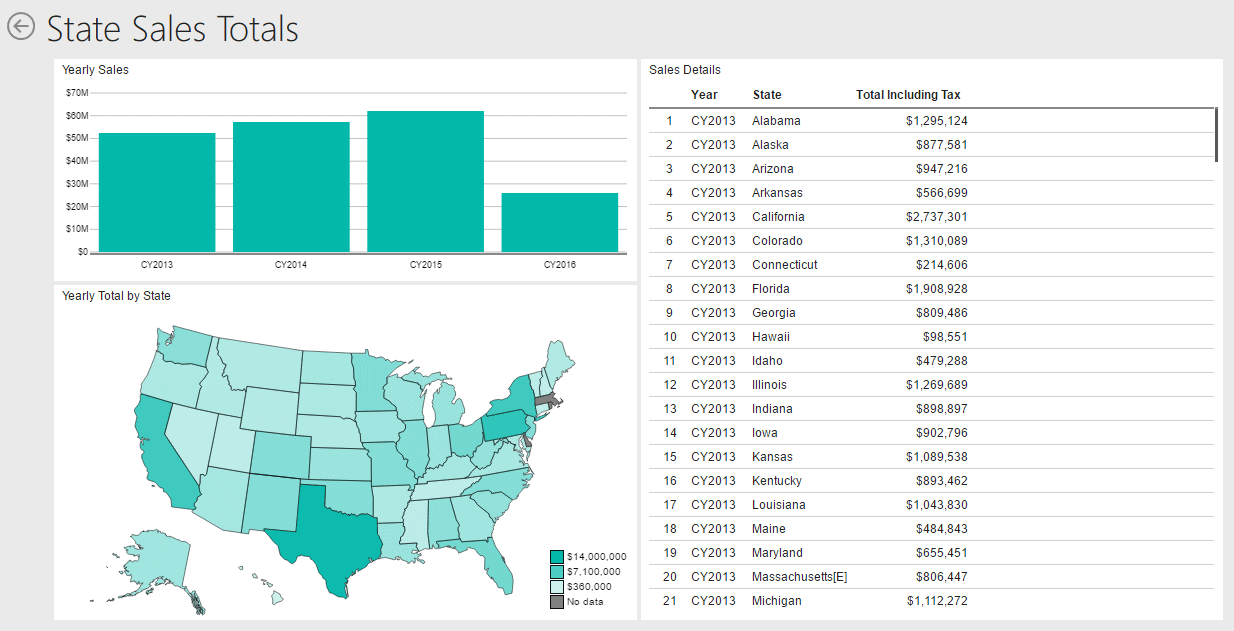
We now have an attractive report but there’s still more to do. Before proceeding though, there’s one thing that should be pointed out regarding the simulated datasets.
Use the arrow to return to the designer. Next click on the Layout button, then click on the Data button to go back. You should see the simulated datasets have vanished. Whenever you return to the data, Mobile Report Publisher checks to see if there are any simulated datasets that are no longer in use, and removes them.
Putting the Mobile in Mobile Report Publisher
We’re finally ready to bring the Mobile to Mobile Report Publisher. Return to the Layout, then click on the white drop down in the upper right.
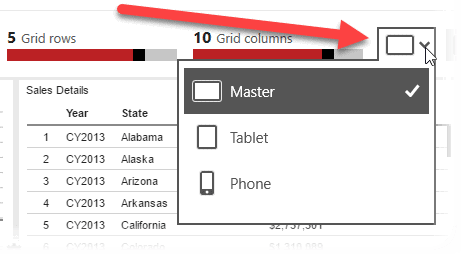
Thus far all the work has been done in the Master layout. This is the layout that will appear when any web browser is used to access this report on the report portal. And Microsoft does mean any. Mobile Report Publisher is HTML5 compliant; your report should render the same whether viewed on Edge in Windows, Firefox on Linux, or Safari on a Mac or iPad.
But what about when you wish to render a special layout when using a mobile device, such as a phone or tablet? For those situations Microsoft has provided the Power BI app. Yes, the same app you can use to view Power BI reports may also be used to view Mobile Report Publisher reports. First though, the layouts for those platforms need to be created. Click on the Tablet option in the menu above.
The layout now updates to (by default) a grid of eight rows by six columns. Begin by placing the Yearly Sales in the upper left, and make it three by three in size. Then place the Yearly Total by State map directly next to it, also three by three. Finally place the Sales Details under them, taking up the remaining space.
Return to the layout menu now, and pick Phone. The layout updates to six rows by four columns. Place the Yearly Sales chart in the upper left, and expand to two rows high by four wide. Next, place the Sales Details underneath, and expand to take up the remaining space.
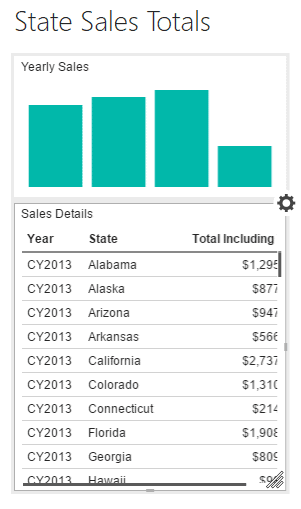
At this point some of you may be going “But Robert! What about the map?” It’s not required you use every report element when creating a layout. For this report, on a layout as small as a phone, the map wouldn’t render large enough to provide useful information, so it was omitted from this report. This is a decision though that should always be made in conjunction with your end user, and based on the data being rendered in the report!
Making It Colorful
Using the layout menu return to the Master layout. Then click the colorful rainbow icon to the right, and you will see a variety of themes appear, from which you can colorize your report.
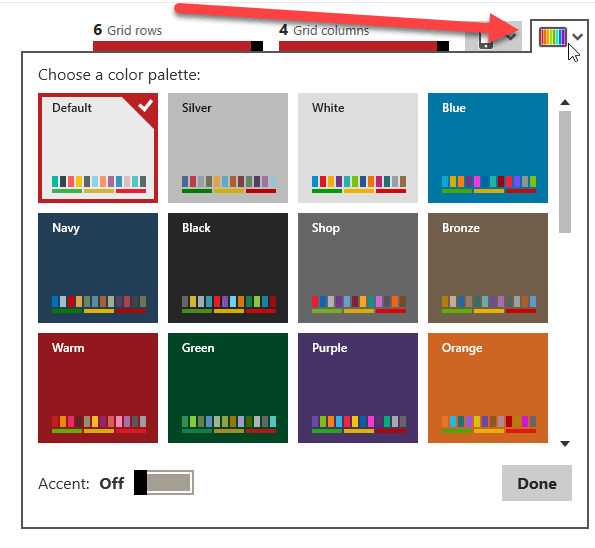
Currently it is not possible to select individual colors for each element, only an overall theme. As this is written the US is in the middle of a wintery cold freeze, so for this example let’s select the Snow theme. Be sure though to look at your selection in all three layouts, Master, Tablet, and Phone, to ensure your data renders visibly with the theme you selected.
Save, Save, Save
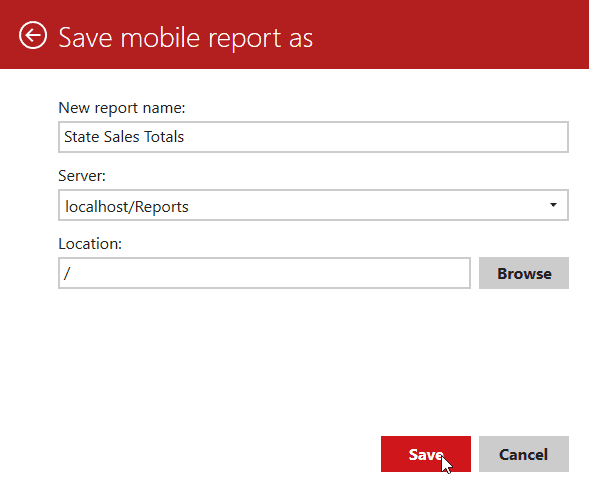
Typically, you will want to save your work as you go, but for this article we’ll save our work now. Just click Save, then select the spot to save it to. During development you may wish to save to the file system, then at the end use Save As to save to the server. For our purposes, pick Save to server.
You’ll then be prompted for the report name, this is the name that will be shown on the SSRS report portal. By default, it uses the report title, but you may change it if you wish. It then asks for the server, and finally the location. It is likely you will want to change the location, so use the Browse button to do so. For this example, it will be saved to the root folder of the report portal, to make it easier to find.
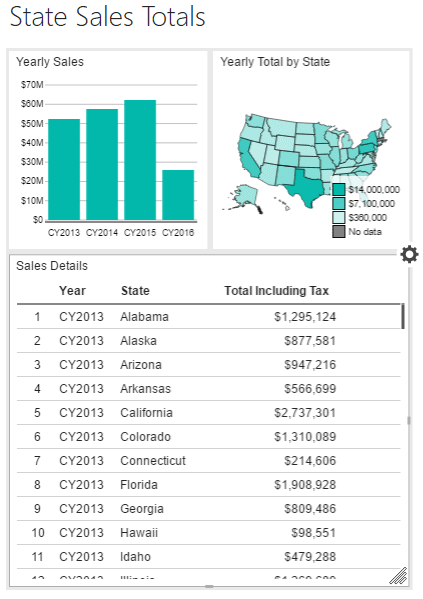
And here it is! On our report portal, you will now see the new State Sales Totals report.
Mobile Report Publisher Everywhere
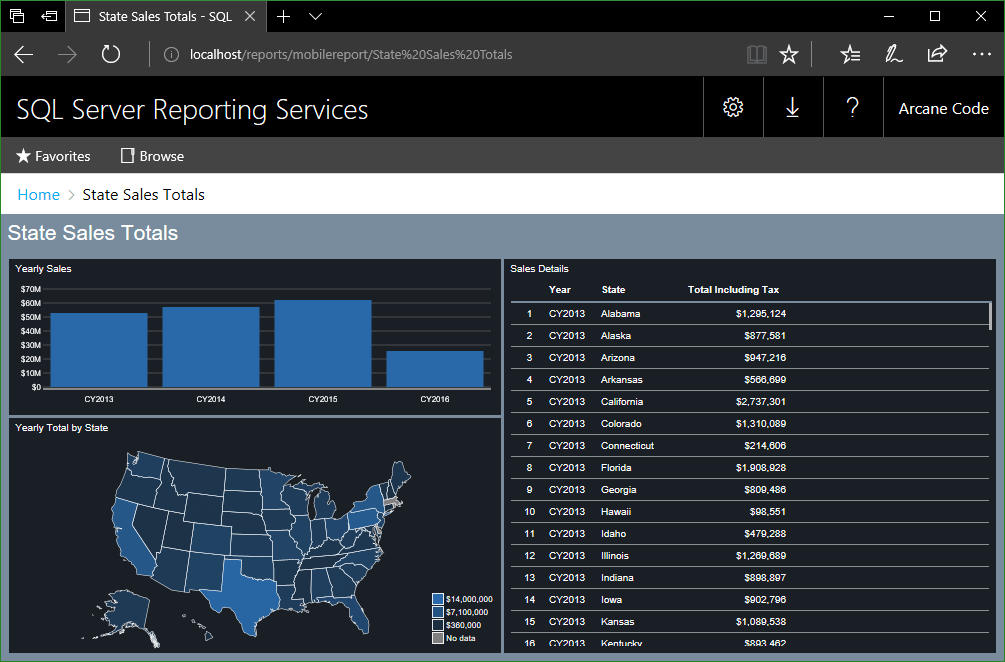
Below is our report, as displayed in Microsoft Edge, running on the SSRS server.
But then you’d expect it to render well on Edge. But what about on another platform all together? Perhaps from a MacBook running on your network?
Well that may require one additional step, depending on where you are running SSRS. If you are running this in an enterprise, your network administrator has worked out the connectivity issues ahead of time, and you likely won’t need this section. But what if you are a developer or student, using the developer edition of SQL Server on your Windows 10 PC at home in order to learn?
Well for those folks, there is one additional step. You will have to open Port 80 on your Windows 10 (or 8 or 7) computer which is running SSRS in order for another computer on your home network to be able to access it. It’s not difficult, but there’s quite a few steps involved, so I’ve put complete instructions on my blog at https://arcanecode.com/2018/01/02/opening-port-80-in-windows-firewall-to-support-calling-ssrs-from-another-computer/ .
So, assuming you have your network configured correctly, either by yourself for your network administrator, how about that example of viewing the report from Safari, running on MacBook Pro? Well take a look:
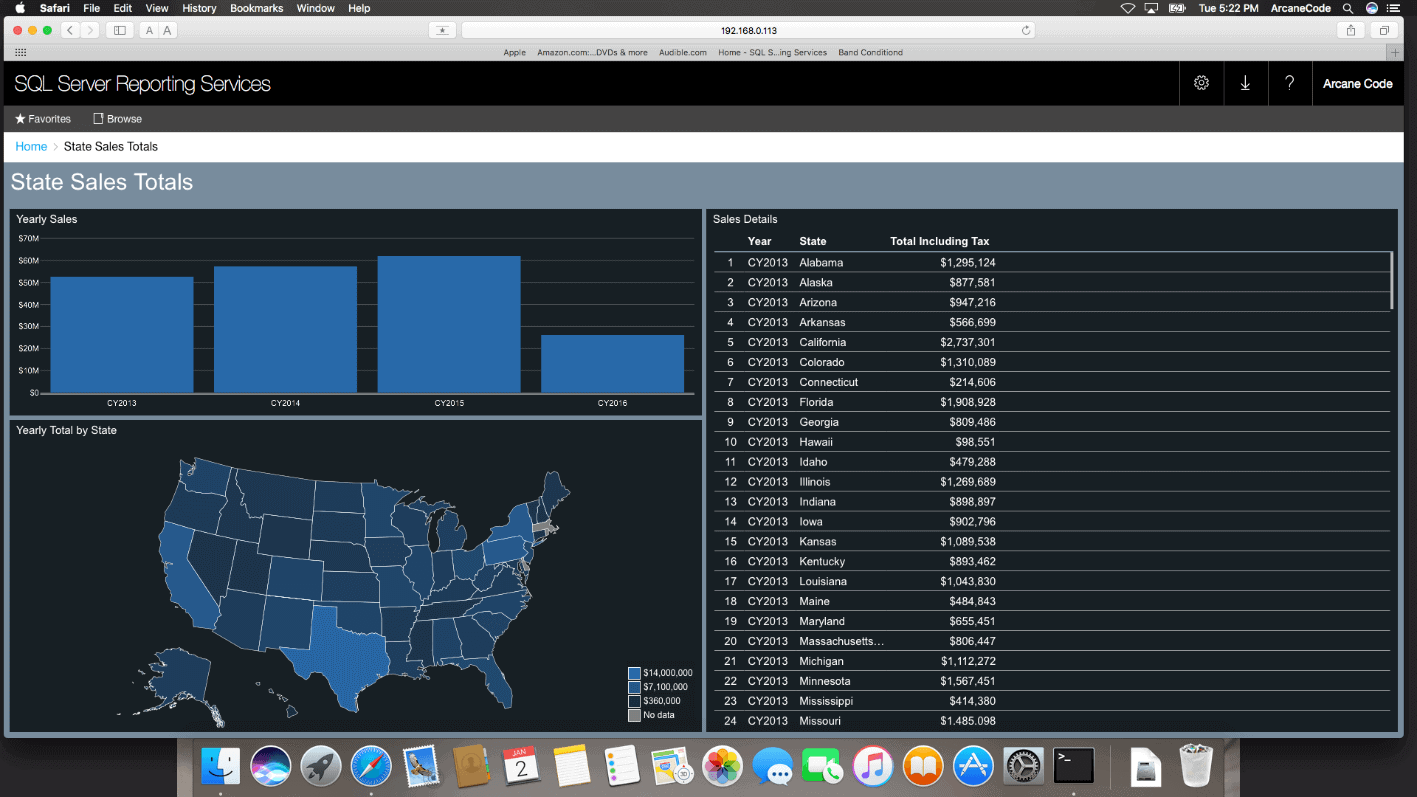
You’ll note I used the IP address of the computer running SSRS, adding the /reports to the end (i.e. http://192.168.0.113/reports for this example). That’s because this network doesn’t have any type of domain setup, so just using the IP address is the simplest method. (To see the IP address, just open a CMD window on your SSRS computer and type in IPCONFIG and press enter, it will show you the IP address.)
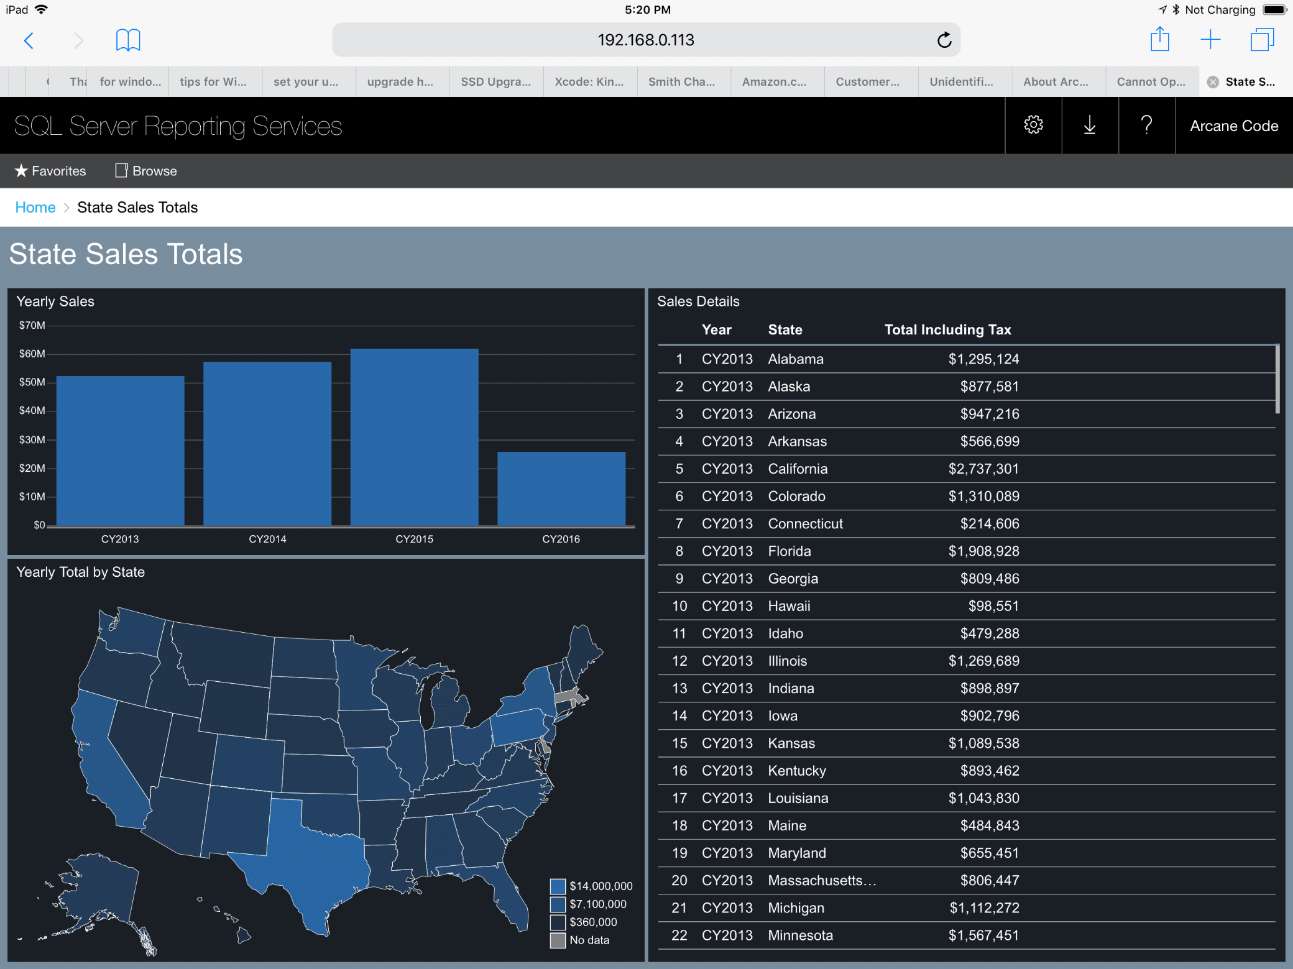
But let’s really push the edge, beyond just a PC. Here’s Safari running on an iPad Pro:
As you can see, when viewed as a webpage Mobile Reports really show up nicely, and consistently, across a variety of browsers and platforms. But what about mobile?
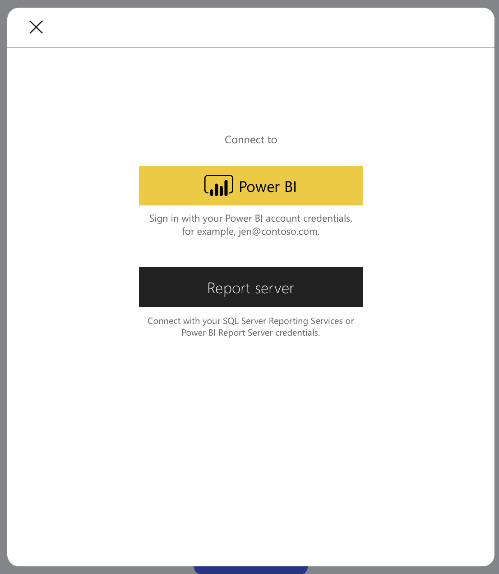
First, you’ll need to get the Power BI app from the AppStore of your preferred device. When you launch it for the first time, you’ll be asked whether you wish to connect to a Power BI server, or a Report server. For this article we’ll pick Report server.
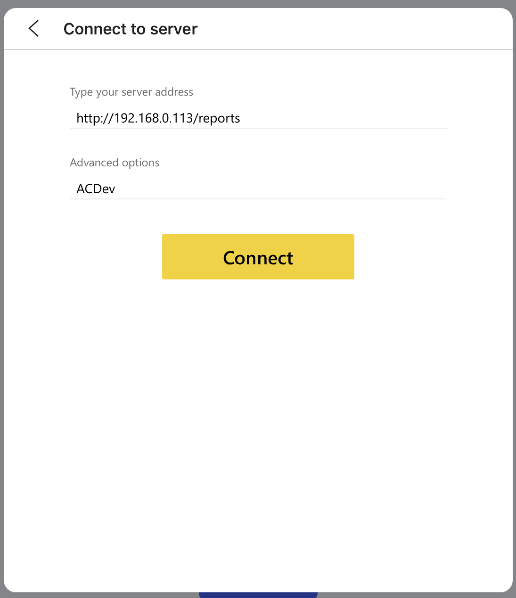
Next, it prompts you for the name of the server to connect to. In the lab used to create this article there’s no domain controller, so the IP address of the computer running SSRS was used. Don’t forget the /reports on the end! For the Advanced options a friendly name for the server was given.
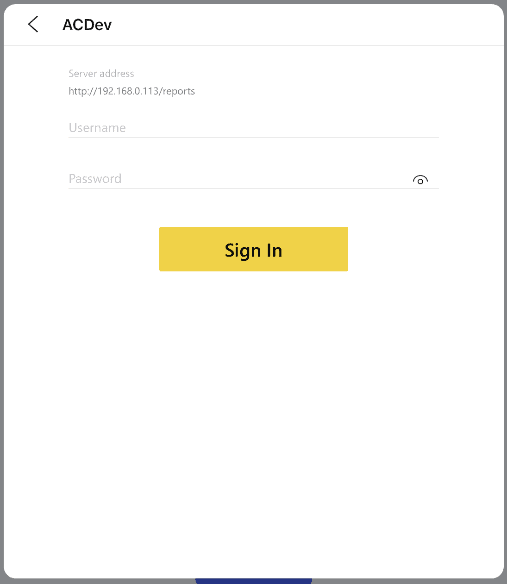
Finally, you will be asked for your login credentials. Provide them and press sign in.
If you have connected to a different Power BI or SSRS server previously, all you need to do is press the menu icon in the upper left, click on the gear in the pop out menu, then click connect to server, and it will walk you through the above steps.
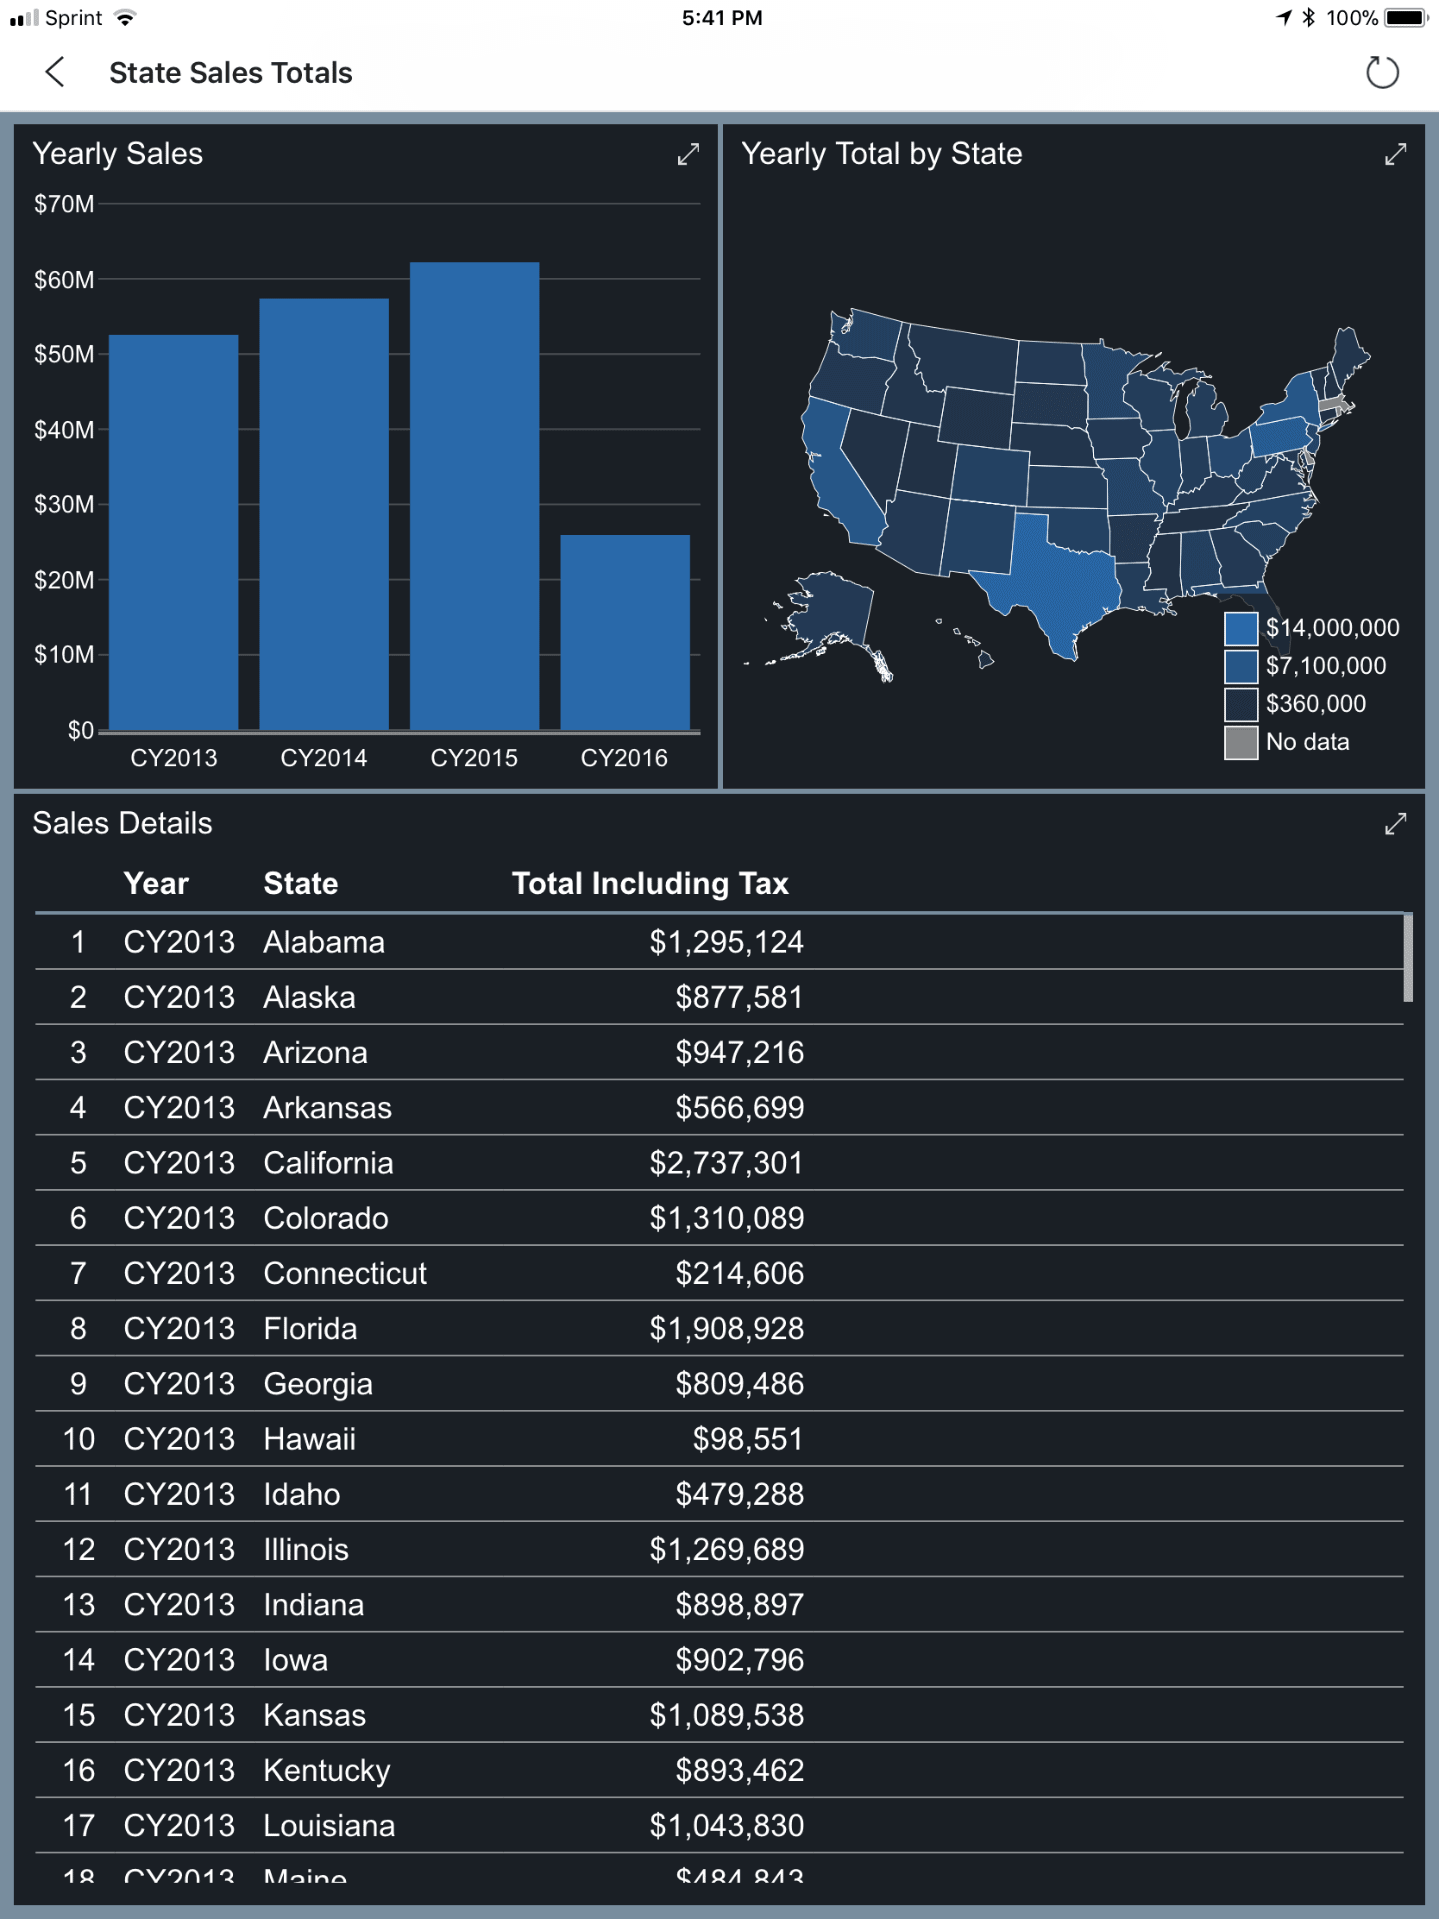
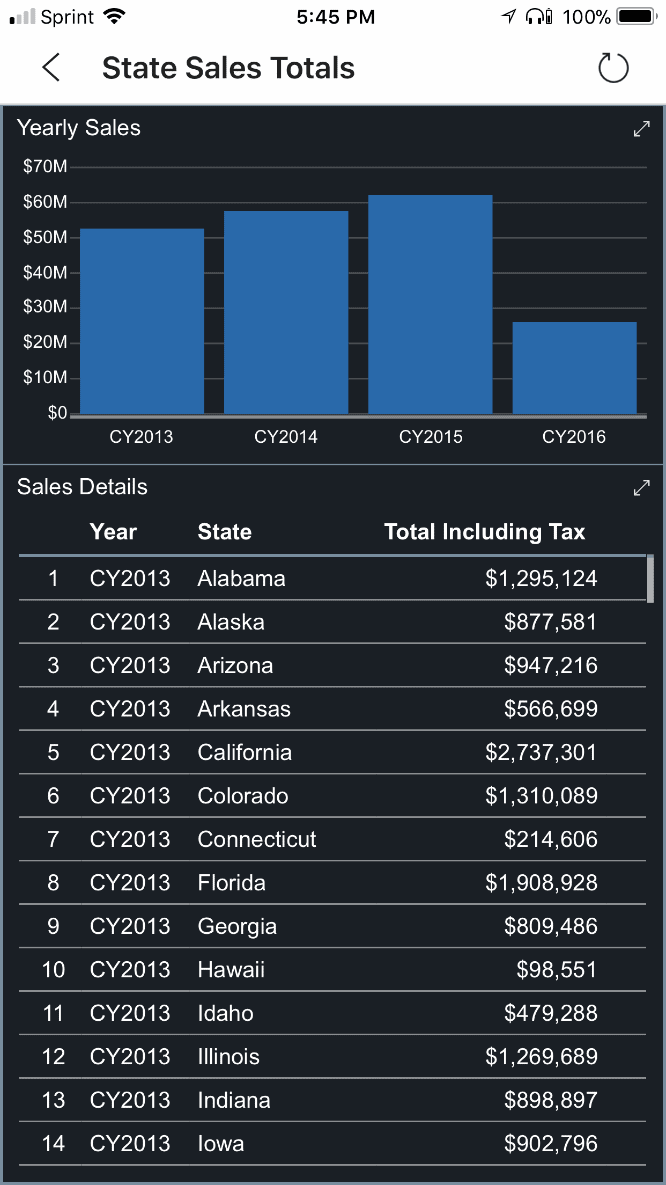
Once in you will be shown the report portal. Simply scroll down to find the mobile report that you just created and tap on it. Here is our report as displayed on an iPad:
Setting up on a phone follows the same steps as above, only the report will be formatted for the phone:
Summary
Mobile Report Publisher is a great tool for creating dashboards. It nicely fits the niche between the line item reports native SSRS is great at producing, and the self-service dashboards Power BI is used for. With a pool of datasets ready to go, dashboards can be assembled quickly and easily, to fit a variety of needs.
This article just tapped the most basic of Mobile Report Publisher’s capabilities. Report elements can be linked together so one report element can act as a filter for another. Drill through is supported, so you can open another Mobile Report, a website, or a SSRS paginated report from a Mobile Report. As you saw, there are also many other report elements available to explore.
Even if you don’t plan on running reports on mobile devices such as tablets and phones, Mobile Report Publisher is still an excellent tool for creating dashboards for use across your enterprise.
Load comments