I was reading an excellent article by Allen White (Twitter|Blog) on Performance Data Gathering (to which I give all the credit for inspiring this module), and that’s when a PowerShell apple fell on my head: “Why not make a function that facilitates this?” As a DBA, one of my almost-daily tasks is to capture and analyze Perfmon counters. You may wonder to yourself, “but you can do that with the get-counter cmdlet in PowerShell 2.0.“
Yes you can, and it is very helpful. However, I need multiple counters, and the results displayed in line with all values separated by commas (which is usually used to facilitate insertion into SQL Server), and that’s when get-counter gets a little trickier to use. I tried to think of an easy way to choose which counters you want, save this configuration for later use, and then insert the output data into a SQL Server table for further analysis. As a result of my tinkering, I believe I’ve got something pretty useful to share with you.
Before I go on, I want to give a shout out to the people who helped me solve some issues I encountered; as always, my friend MVP Shay Levy (Twitter|Blog), and also MVP JVierra , Trevor Sullivan (Twitter|Blog), and Lauri Kotilainen (Twitter|Blog) . A special thank-you goes to MVP Pinal Dave (Twitter|Blog), who invited me to be a guest blogger on SQLAuthority.com, and MVP Grant Fritchey (Twitter|Blog) for the kind words on his blog.
This article will cover how to use this new module in a variety of situations, with some clear and every-day examples to hopefully make everything obvious. To start with, I’ll walk you through how to find out more information on the various Perfmon counters, so that you can choose which ones you want to use, as well as how to save that configuration so that you can reuse it later (and on different servers). Once we’ve covered that, we’ll take a look at how to get the data collected, and two ways to store it once we’ve got it.
Performance Counters
A polished version of this whole module will be available in the next release of SQLPSX – SQL Server PowerShell Extensions. For now, you can download it from the top of this article, and I should point out that this module is a V1, so it might (and probably will) have some issues, and you can contact me anytime if you need a hand. Alternatively, you can use the built-in help to see all of the parameters and some examples:
|
1 |
Get-Help Get-PerfCounterCategory -examples |
All tests were done on two Hyper-V 64-bit Virtual Machines; a Windows 2008 Server R2 domain controller with SQL Server 2008 R2 (Obiwan), and a Windows 7 machine with SQL Server 2008 (Chewie). Before you get started, if you want to work with multiple servers, you need to enable the RemoteRegistry Service in the remote machines , as you can see :
Figure 1.Ensuring the RemoteRegistry Service is active on the remote machines.
For further reading on why this is necessary, I suggest you take a look at “Why run the RemoteRegistry Service?” by Brian Groth.
Top Tip: If you want to know which information (properties) are returned by a given functions, type: Function | get-member -membertype noteproperty. For example: Get-PerfCounterCategory | Get-Member -MemberType NoteProperty
Finding the Information
The thing that most bothered me at the start of this project was that, for some counters in Perfmon, I knew their names but could not remember exactly which category they were in. I’ll give you a few examples. Let’s say you remember that Buffer Cache Hit Ratio is in one of the SQL Server categories, but which one? We know that it’s painful to look in IDE for the answer, so now it’s much easier; if you want to discover all the registered categories, you can use this command:
|
1 |
Get-PerfCounterCategory |
Alternatively, if you want to be more fine-grained and only discover the categories starting with “SQLServer“, ordering by Category Name, then use this command:
|
1 2 3 |
Get-PerfCounterCategory -CategoryName "SQLServer*" | Sort-Object Category_name | Format-list Machine_Name,Category_Name,Category_Type, Category_Description |
Figure 2. Results for the Get-PerfCounterCategory cmdlet.
Each Performance Counter category has a number of instances, or it can have just a single instance. For example, with the Processor Counter, you can have one instance for each processor, and with Buffer Manager you have only a single instance. You can see the information for, as an example, all instances in the Processor category by typing:
|
1 2 3 |
Get-PerfCounterCategory -CategoryName "PROCESSOR*" | Get-PerfCounterInstance | Sort-Object Category_name | Format-list Machine_Name,Category_Name, Instance_name |
What’s that I hear you ask? Can you get all counters in all instances and categories? Yes, of course you can… and with some help information about each counter, too:
|
1 2 3 |
Get-PerfCounterCategory | Get-PerfCounterInstance | Get-PerfCounterCounters | Format-List Machine_Name,Category_Name,Counter_Name,Counter_Type, Counter_Help |
Figure 3. All counters in all instances and categories, with information.
How about if you want to see all the counters from Buffer Manager category? Just use:
|
1 2 3 |
Get-PerfCounterCategory -CategoryName "*Buffer Manager*" | Get-PerfCounterInstance | Get-PerfCounterCounters | Format-List Machine_Name,Category_Name,Counter_Name,Counter_Type,Counter_Help |
And if I want to work with multiple servers? Simple, just pipe the servers names into the cmdlet:
|
1 2 3 |
"Obiwan", "Chewie"| Get-PerfCounterCategory -CategoryName "*Buffer Manager*" | Get-PerfCounterInstance | Get-PerfCounterCounters | Format-List Machine_Name,Category_Name,Counter_Name,Counter_Type,Counter_Help |
… Or use a flat text file with the servers’ names inside it:
|
1 2 3 |
Get-content servers.txt | Get-PerfCounterCategory -CategoryName "*Buffer Manager*" | Get-PerfCounterInstance | Get-PerfCounterCounters | Format-List Machine_Name,Category_Name,Counter_Name,Counter_Type,Counter_Help |
As you can see , we can perform the search for missing information in various ways, facilitating the process of selecting the appropriate counters .
Setting an XML Configure File
When I started writing this module, my big goal was that I should somehow be able to be mobile with the counters that I chose. That is, I should be able to save and then later use the same configurations as easily within the original server as any another. After thinking about it, I decided that the gathering of data should start with reading an XML configuration file containing all the counters I’m interested in, and that I should have one file for memory counters, one for processor counters, and so on, to segment the data gathering .
It seems like it might be a really complicated solution, especially when XML is involved, but thankfully it’s not too bad, as you’ll see in a moment. To start with, creating an XML file with all the counters from the Processor category and _Total instance is as simple as running:
|
1 2 3 |
Get-PerfCounterCategory -CategoryName "Processor*" | Get-PerfCounterInstance -InstanceName "_Total" | Get-PerfCounterCounters | Save-ConfigPerfCounter -PathConfigFile c:\temp\TemplateProcessor.XML -NewFile |
If you then look in your C:\temp folder, an XML file called TemplateProcessor_MACHINENAME.XML will be there, ready to be used.
Top Tip To facilitate the ability to identify and use multiple servers in your data-gathering process, the name of the target machine is added to the name of both the output file and the XML config file.
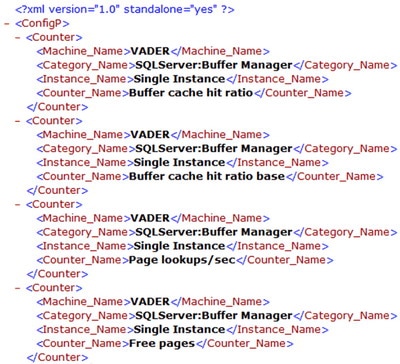
Figure 4. Generating an XML file containing the Perfmon configuration
As you can see, in this example I used the -NewFileswitch parameter which, naturally, creates a new .XML file. Perhaps you’re wondering whether there are situations where I would not use this parameter? Let’s say we have a file specifying just the Buffer Cache Hit Ratio counter from the Buffer Manager category:
|
1 2 3 4 |
Get-PerfCounterCategory -CategoryName "*Buffer Manager*" | Get-PerfCounterInstance | Get-PerfCounterCounters -CounterName "*cache hit ratio" | Save-ConfigPerfCounter -PathConfigFile c:\temp\TemplateBufferManager.XML -NewFile |
However, now we need to add the Page Life Expectancy counter to the already-existing file, so we just omit the -NewFile parameter, and the selected counters will be added to the XML file, rather than overwriting it:
|
1 2 3 |
Get-PerfCounterCategory -CategoryName "*Buffer Manager*" | Get-PerfCounterInstance | Get-PerfCounterCounters -CounterName "page life*" | Save-ConfigPerfCounter -PathConfigFile c:\temp\TemplateBufferManager.XML |
To create the configuration file in such a way that multiple servers can use it, we just need to specify the desired machines…
|
1 2 3 |
"ObiWan", "Chewie" | Get-PerfCounterCategory -CategoryName "*Buffer Manager*" | Get-PerfCounterInstance | Get-PerfCounterCounters | Save-ConfigPerfCounter -PathConfigFile c:\temp\BufferManager.XML -NewFile |
… and a separate file will be created for each server, using the name passed in the -PathConfigFile parameter and adding the server name:
Figure 5. Creating configuration files for multiple servers.
Gathering Data
With all that set up, the next step, starting to actually gather information, is a bit more complicated. Let’s take a look:
To start with, the command below allows us to gather data using the counters defined in C:\temp\TemplateBufferManager_Obiwan.XML , starting the collection job on 05/24/2010 08:00:00 AM, ending it on 05/30/2010 22:00:00 PM, with an interval of 10 seconds between each data collection, and outputting the values to C:\temp\ TemplateBufferManager.txt:
|
1 2 3 4 |
Set-CollectPerfCounter -DateTimeStart "05/24/2010 08:00:00" -DateTimeEnd "05/30/2010 22:00:00" -Interval 10 -PathConfigFile c:\temp\TemplateBufferManager_Obiwan.XML -PathOutputFile c:\temp\TemplateBufferManager.txt |
When you run this command, you will notice that the PowerShell session will be locked; the function is in a loop to gather the data, and while this loop is running the session will be locked. Thankfully, we can resolve this by simply adding the -RunAsJobparameter, which tells PowerShell to perform this procedure asynchronously:
|
1 2 3 4 |
Set-CollectPerfCounter -DateTimeStart "05/24/2010 08:00:00" -DateTimeEnd "05/30/2010 22:00:00" -Interval 10 -PathConfigFile c:\temp\TemplateBufferManager_Obiwan.XML -PathOutputFile c:\temp\TemplateBufferManager.txt -RunAsJob |
As you may have guessed, this parameter creates a Job, and when you’re working with Jobs there are some things you have to take into consideration: The job created will be called “PERFCOUNTERS_” plus the name of the XML file and the current time (YYYYMMDDHHMMSS). In the case of my example, the name will be: PERFCOUNTERS_TemplateBufferManager_OBIWAN_20100306193300.
Of course, if you’re working with Jobs, then you’ll want to see which jobs are running:
|
1 |
Get-job -state Running |
To call the specific data-gathering Job, use ID or Name (which you have discovered using the command above):
|
1 2 |
get-job -name PERFCOUNTERS_TemplateBufferManager_OBIWAN_20100306193300 | format-list |
To see if the job is running without errors, run the Receive-Job cmdlet, and heed Marco Shaw’s (Twitter | Blog) excellent advice:
“… when using receive-job, one may want to use the switch parameter -keep. Otherwise, any associated output is lost if receive-job is run again.“
With the -keep parameter, the output is retained on the screen when you next run the receive-job cmdlet. So, with that in mind, our investigative command is now:
|
1 2 |
get-job -name PERFCOUNTERS_TemplateBufferManager_OBIWAN_20100306193300 | receive-job -keep |
Alternatively, if we want to see all jobs used by the PerfCounters Module, we just need to return all jobs starting with “PERFCOUNTERS…“, so we can use where-object to find what we need:
|
1 |
get-job -State running | Where-Object {$_.name -like "PerfCounters*"} |
And finally, if I want to stop the job before the date set in the Set-CollectPerfCounter command, I just need to type:
|
1 2 3 |
stop-job -name PERFCOUNTERS_TemplateBufferManager_OBIWAN_20100306193300 or stop-job -id <job id> (The Job ID can be found using Get-Job) |
Figure 6. Finding out what state the PerfCounter jobs are in.
Uploading Data to a SQL Server Table
We can do this in one of two ways; the first method is bulk inserting the .txt file, and the other is, when the data is being gathered, to save it directly into a SQL Server Table. Let’s take a closer look:
Bulk Inserting
After you’ve run your data-gathering job, you will see that the .txt file is ready to be inserted into SQL Server using a simple T-SQL bulk insert, and the Save-PerfCounterSQLTable function will help you do that. The command below will upload the output .txt file, and create a new table to receive the data (using -NewTable switch parameter):
|
1 2 3 |
Save-PerfCounterSQLTable -ServerName Vader -DatabaseName Master -NewTable -PathConfigFile c:\temp\TemplateBufferManager_ObiWan.xml -PathOutputFile c:\temp\TemplateBufferManager.txt |
Alternatively, if you want to upload the output .txt file into an existing Table, simply omit the -NewTable switch parameter and pass the target table name in the -TableNameparameter:
|
1 2 3 4 |
Save-PerfCounterSQLTable -ServerName Vader -DatabaseName Master -TableName PerfCounterSQLTable_20100528100655 -PathConfigFile c:\temp\TemplateBufferManager.xml -PathOutputFile c:\temp\TemplateBufferManager.txt |
If you prefer to have a bit more control of your tables, it’s a simple matter to combine the two previously mentioned switches to upload the .txt file and create a new table to receive it, with a name chosen by you :
|
1 2 3 |
Save-PerfCounterSQLTable -ServerName Vader -DatabaseName Master -TableName MyTableName -NewTable -PathConfigFile c:\temp\TemplateBufferManager.xml -PathOutputFile c:\temp\TemplateBufferManager.txt |
As you may have noticed, the PathConfigFile and PathOutputFile parameters, which contain the full paths of the XML configuration file and output file respectively, are required. If you’d like to learn more about the Save-PerfCounterSQLTable command, use :
|
1 |
Get-Help Save-PerfCounterSQLTable -full |
Saving directly into SQL Server Table:
To best demonstrate this, let’s create a complete example. First, we choose the counters that we want to use. In case, this is the whole SQL Server Buffer Manager category on the Chewie and ObiWan machines, as well as the Processor category on Chewie. We save this configuration into C:\temp\BufferManager.XML and c:\temp\Processor.XML
|
1 2 3 4 5 6 |
"ObiWan", "Chewie" | Get-PerfCounterCategory -CategoryName "*Buffer Manager*" | Get-PerfCounterInstance | Get-PerfCounterCounters | Save-ConfigPerfCounter -PathConfigFile c:\temp\BufferManager.XML -NewFile "Chewie" | Get-PerfCounterCategory -CategoryName "Processor*" | Get-PerfCounterInstance | Get-PerfCounterCounters | Save-ConfigPerfCounter -PathConfigFile c:\temp\Processor.XML -NewFile |
Figure 7. The demo configuration files for Obiwan and Chewie.
Now, with the XML configured, we can now start the gathering of data using background Jobs and saving their output directly into a SQL Server Table. We do not pass the target SQL Server table name as a parameter, so one table will be created for each server, using the naming format of PERFCOUNTERS_XMLFileName_YYYYmmDDhhMMss. Even though you’re using a SQL Table as a data repository, you must pass the path to an output file into your command, because the output file always will be created. Why, you ask? Let’s say you lose your connection to the SQL Server repository; this way, you don’t also lose the data, because it will also be stored in the .txt file. In this case, as we using several different XML files, we’ll only pass the target path, without the file name, and will be creating output files in this location using XMLNAME_MACHINENAME.TXT as a naming convention.
|
1 2 3 4 |
dir "c:\temp\*.Xml" | Set-CollectPerfCounter -DateTimeStart "05/24/2010 08:00:00" -DateTimeEnd "06/30/2010 22:00:00" -Interval 10 -PathOutputFile c:\temp\ -ServerName ObiWan -DatabaseName Testes -NewTable -RunAsJob |
Figure 8. Creating the jobs to gather data, and sending the collected data directly to a SQL Server table.
As you can see from figure 8, three jobs are created, and their names all start with PERFCOUNTER, so you can use where-object to quickly and easily find all jobs used by the PerfCounters Module:
|
1 |
Get-Job -State Running | Where-Object { $_.name -like "Perfcounter*" } |
Now, if we look in ObiWan’s SQL Server, we can see that there are three tables with the collected data: one for each machine we gathered data from (i.e. one for each XML file):
Figure 9. Investigating the gathered data in SQL Server.
… And the .txt files containing the same gathered output are created as well:
Figure 10. The gathered data, stored in .txt files.
When you’re setting this up, you can use your own table name to make things easy to find; I am passing the -TableName parameter with “BufferManager“, and so for each machine, a table called BufferManager_MACHINENAME will be created. In this case, BufferManager_Chewie and BufferManager_ObiWan:
|
1 2 3 4 |
dir "c:\temp\BufferManager*.Xml" | Set-CollectPerfCounter -DateTimeStart "05/24/2010 08:00:00" -DateTimeEnd "06/30/2010 22:00:00" -Interval 10 -PathOutputFile c:\temp\BufferManager.txt -ServerName ObiWan -DatabaseName Tests -NewTable -RunAsJob -TableName "BufferManager" |
Figure 11. Investigating the data stored in our custom-named tables.
Perhaps you’re wondering why it’s so useful to be able to specify the target table name? Let’s say you stop the gathering, and want to continue on a completely different day, but outputting the data to the same table. Just Pass the -TableName parameter with the name of the original table, and don’t pass the -newtable switch parameter:
|
1 2 3 4 |
Set-CollectPerfCounter -PathConfigFile c:\Temp\BufferManager_Chewie.XML -DateTimeStart "05/24/2010 08:00:00" -DateTimeEnd "06/30/2010 22:00:00" -Interval 10 -PathOutputFile c:\temp\BufferManager.txt -ServerName ObiWan -DatabaseName Testes -RunAsJob -TableName "BufferManager_Chewie" |
Remember, in this case you have to explicitly declare the XML file and, in the case of the code snippet above, I will restart the data gathering to Chewie, with C:\temp\BufferManager_Chewie.xml as the configuration file, and the BufferManager_Chewie table as the SQL Server repository. The data is saved without creating a new table, and the output .txt file is always created as a data backup.
In these examples I use Windows Authentication, but you can pass the Username and Password as parameters. If you get stuck at any point and want some more information, just type get-help <FunctionName> -examples.
Well folks, I hope you can get some good use out of this module, as I am. Once again, PowerShell wins.
Top Tip
When I was doing this article, I accidentally created 857 tables in SQL Server, and I had to drop them. Is that complicated? Not at all – here’s a hint:
dir |% {$ _.drop ()}
…where % is an alias for a foreach-object.

Load comments