The Performance Analysis of Logs tool is one of my favorite free tools for SQL Server. It is freely available on Codeplex. I used this tool extensively as a production DBA. It simplified the collection of data from Performance Counters in my own servers. Now, I advise my clients to use this tool to collect and analyze performance counters related to SQL Server for diagnostics, sizing new hardware, and for general monitoring of a SQL Server instance. It saves them a significant amount of my billable time.
The PAL tool was written at Microsoft by a Premier Field Engineer (PFE) named Clint Huffman. The tool was designed as a broad solution for collecting and analyzing data; allowing the use of templates to define data collection sets and rules. There are different PFEs at Microsoft that have volunteered their time to be responsible for the templates and analysis rules that are associated with their specific product. An email address of the PFE who is responsible for each template is included in it. You can use this to get answers to questions about the best way to use the template, or for questions about the rules that are being applied in the data analysis by the template. The template for SQL Server is maintained by a good friend of mine on the PFE Team for SQL Server, David Pless.
Using the PAL Templates
The PAL tool has built-in templates for configuring Performance Counter Data Collector Sets inside of Windows: This includes all of the key counters necessary for monitoring the performance of a SQL Server Instance, along with many of the other products in the Microsoft product stack outside of SQL Server. This makes the tool useful for ‘accidental DBAs’, or better put, server administrators that have responsibilities outside of SQL Server, for analyzing performance of other products that they’re responsible for adminstering. As a consultant I’ve routinely demonstrated this tool for non-DBAs along with the DBA staff to show them how they can easily exploit the tool for analyzing the other servers within their infrastructure.
The “Threshold File” tab in the PAL tool provides access to the templates included in the tool in a dropdown box as shown in Figure 1.
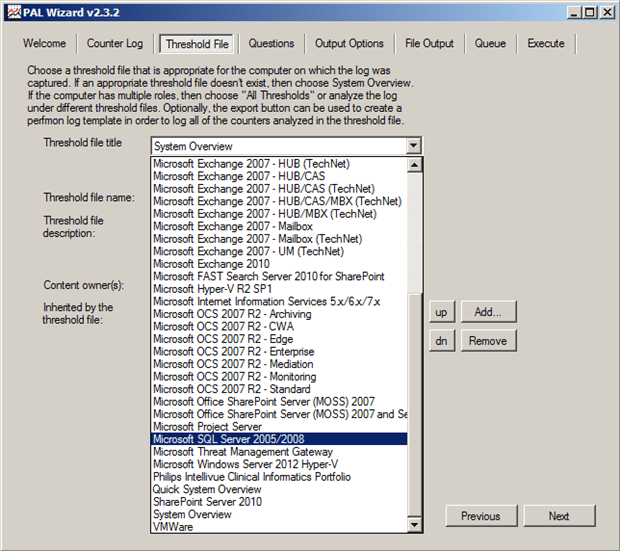
Figure 1: Selecting a Template
After selecting a template, the templates definition can exported to a Performance Monitor or Logman template by clicking on the Export to Perfmon template file button, which can then be used to create a Data Collector Set. The template will contain all of the counters that are commonly used for diagnosing performance problems for the application that was selected in the dropdown. The threshold file can also be edited, which allows you to see which counters are being analyzed, a description of the performance counters meaning, and the rules that will be applied during analysis of the data from a server. By reviewing this information, you can really gain a lot of insight into how to identify performance problems manually as well.
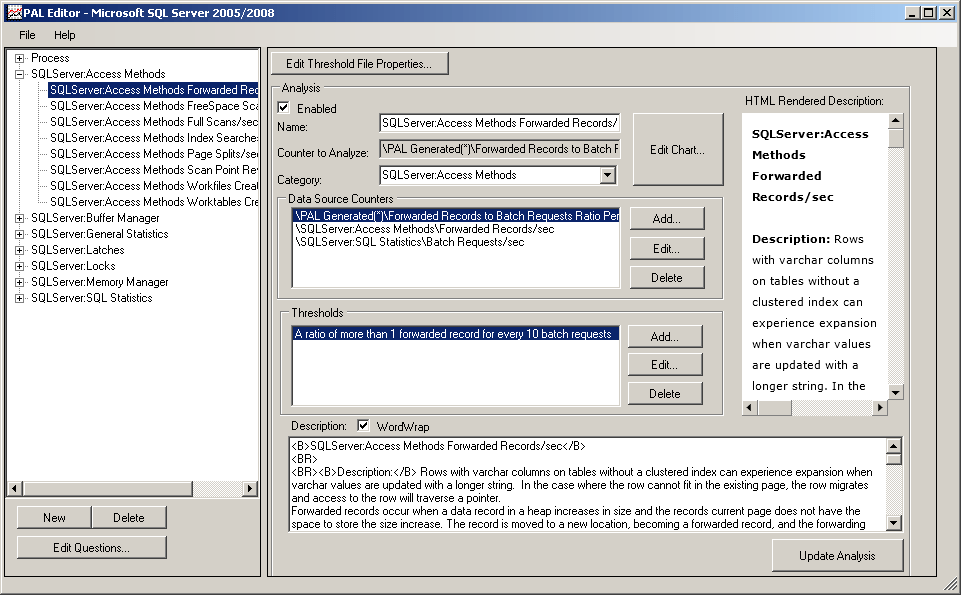
Figure 2: Editing the threshold file definition (click to enlarge)
Although these two features are beneficial, they aren’t the real power behind the PAL tool. The primary purpose for the tool is to provide automated analysis of the performance counter data after collection. The wizard guides you through selecting a performance counter log-file on the Counter Log tab, and then selecting the appropriate Threshold File to perform the analysis against. The wizard then presents questions that have been defined as a part of the threshold file about the server that the data was collected from. For SQL Server, there are six questions as shown in Figure 3. These are…
- The number of processors
- Whether the /3GB startup switch was used (which only applies to 32-bit instances)
- Whether the instance was 64-bit or not
- The amount of RAM installed in the server
- Which disks use RAID 5
- Which disks use RAID1/10
The answers to these questions are then used as a part of the analysis of the performance counter data since different thresholds apply to some counters based on the hardware configuration.
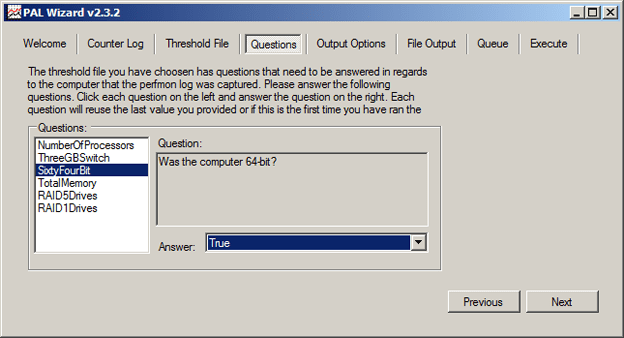
Figure 3: Questions
After answering the questions for the threshold file, the Output Optionsscreen, shown in Figure 4, is presented to allow you to configure how you want the data to be analyzed for the output to be generated. The Analysis Interval allows you to specify the amount of time to slice the collected data into separate intervals for applying the analysis. This is very useful if you know your workload and your data collection period. The default configuration of AUTO will look at the total duration for the counter log-file and then divide that time up so that 30 even time slices exist for the analysis in the report output. However, if you know that your data collection was for a specific time period, for example 7AM to 7PM, based on before, during and after your normal business workload, you might want to specify a analysis interval of 4 hours so that you can see just three slices of data in the report.
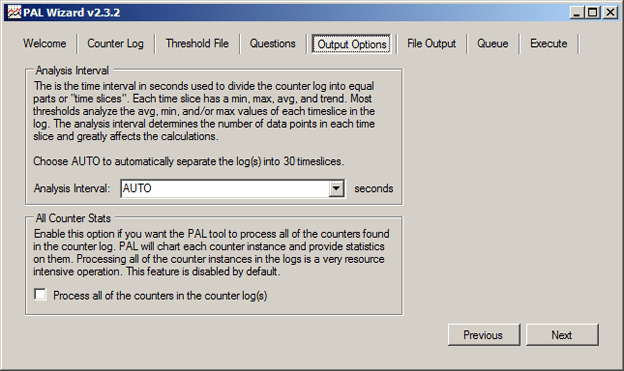
Figure 4: Output Options
The output options also provide the means to specify that the analysis should include all of the counters that are available in the counter log-file, even if they are not a part of the threshold template that you are actually using, in the All Counter Stats block. This can be useful when you’ve added additional counters to the counter log collection, for example I like to add in the VM Memory and VM Processor counters if I am looking at a VMware VM at times. However, depending on the number of additional counters in the log-file, this can be a resource-intensive operation as explained in the description and it therefore should be disabled by default.
The file output format can be controlled on the next screen of the PAL tool, the File Output screen. This screen provides the specifics for the final output of the report that gets generated by the tool, as shown in Figure 5. Typically, the default output to HTML is the best format for most analysis tasks. The default output location is to the ‘executing users My Documents\Pal Reports‘ file path. If necessary, the output can be redirected to an XML format by changing the output to the XML Output option.
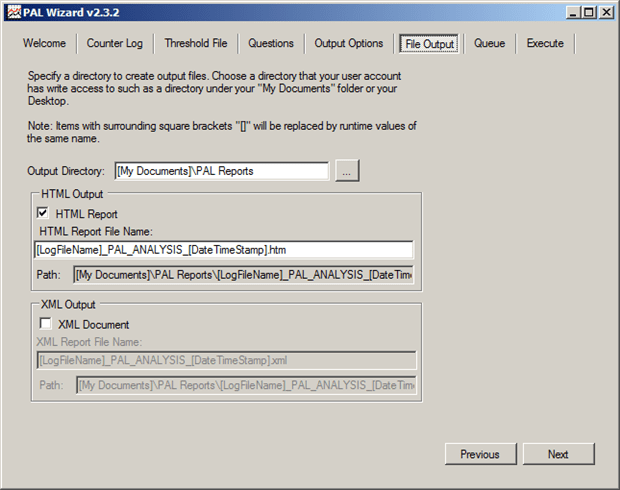
Figure 5: File Output
Once the file output has been configured, the PowerShell script that will be queued or executed to process the performance counter file is displayed. This is only for reference. On the ‘Execute‘ tab, shown in Figure 6, you have the option to execute the current configuration to process the counter log-file, or you can add the current file and configuration to a queue so that you can configure multiple counter logs to be processed as a single queue. If you want to process multiple log files individually rather than queuing multiple files up, for example, you have several servers from which you collected data and they have the same configurations, you can select the option to ‘Execute and restart’ which will execute the processing of the current queued tasks, and then restart the wizard with the exact same configuration settings again. Once the processing executes, the PAL tool will open a command prompt window and close the UI wizard to perform the processing of the counter log-file and report generation.
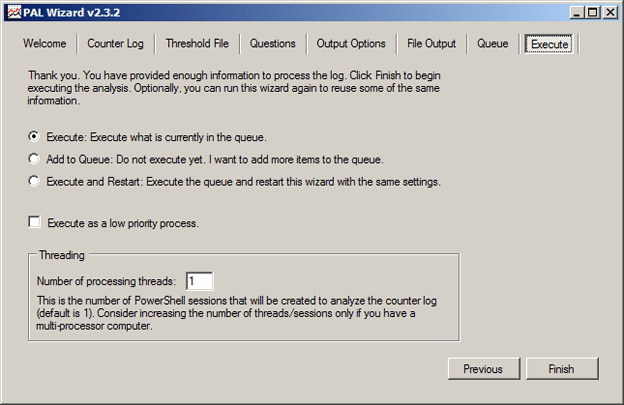
Figure 6: Execution Options
Executing the queue will open a command prompt window that shows status information about the analysis of the counter log-files data. Depending on the size of the counter log being analyzed, the processing can take as little as few minutes or as long as a few hours, depending on the hardware of the machine being used for the processing. One of the options in the Execute tab is to perform the processing as a low priority process so that it doesn’t consume excessive amounts of resources, but the tradeoff for this is slower processing time which typically is acceptable for the report generation. There is also the option to increase the number of threads being used for the report generation to allow it to run faster if necessary. Once the analysis completes, if the output format was set to generate an HTML report, the report will be launched in Internet Explorer. An example report is shown in Figure 7 below.
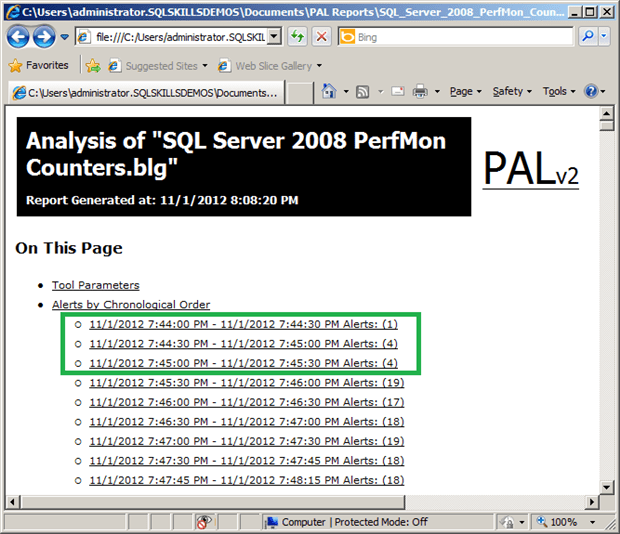
Figure 7: Report information with alerts
There are links at the top of the report that provide click-through access to the information contained in the report. The first link is to the Tool Parameters, which are the answers to the questions for the Threshold File being used for the analysis by the tool. Then a section exists for the alerts for each of the time slices defined in the Output Options tab in the tool. These will show instances of counters that were outside of the threshold values during the data collection and will also include additional links to provide drilldown into the individual alerts to determine where problems might exist. After the alerts section, each of the categories of performance counter is listed with links to provide click through access to the charts and table data for the individual counters. An example of the data provided is shown in Figure 8 for the SQLServer:General Statistics Logins/sec counter.
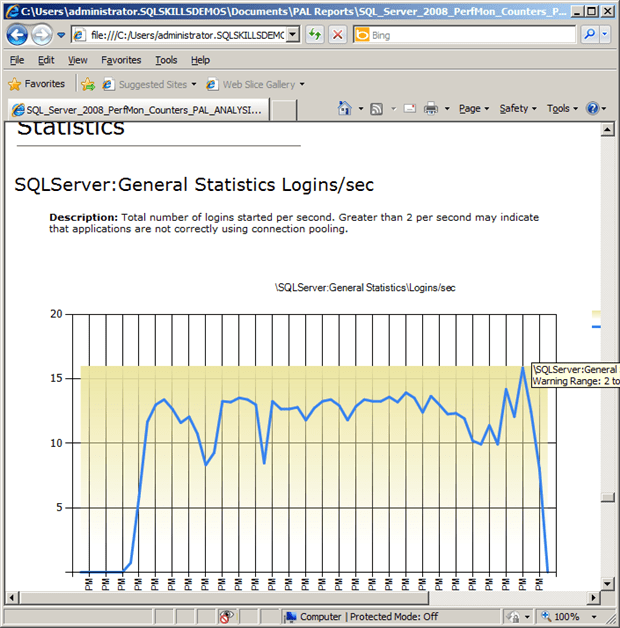
Figure8: SQLServer:General Statistics Logins/sec counter
Summary
The PAL tool simplifies the collection and analysis of the data from performance counters for a large number of common applications. The tool provides a base template that is customized to each of the applications it supports; and this can then be further customized as necessary for the specific needs of your IT environment. You can, for example, add additional counters to the data collection for virtual machines that are specific to the hypervisor being used, or add counters that have additional benefit for your needs. By selecting the option to process all of the counters in the log, these additional counters will be processed to generate charts, even though no threshold data actually exists in the Threshold File for those counters during the analysis, allowing you to do further manual review of the data from the report. The tool allows you to generate a queue to process multiple performance counter collection files using different parameters for the report generation, or to process a single file based on your specific needs.
As a consultant, I use this tool frequently for capturing baseline information from client systems and to reduce the time it takes for me to analyze the information for them. For some of the counters being collected, I either customize the Threshold File definition or apply my own analysis to the data based on the specific configuration that I am looking at. I also teach this tool to clients, not just DBAs but also their server administrators as well. It is difficult to describe the great value of this tool; it is best to demonstrate it.
Load comments