
The series so far:
- Introduction to DAX for paginated reports
- How to filter DAX for paginated reports
- DAX table functions for paginated reports: Part 1
- DAX table functions for paginated reports: Part 2
- Tips and tricks with DAX table functions in paginated reports
To conclude this short set of articles on using Power BI datasets as the source of data for paginated reports, I want to outline a few classic solutions to common challenges in paginated report development with DAX.
Clearly, I cannot recount every paginated report challenge that I have ever met (or heard of) when creating reports from a Power BI dataset. However, as a report developer, it helps to be aware of some of the standard solutions to the challenges that many users encounter.
This article uses the accompanying sample data (CarsDataWarehouse.pbix) as the basis for the DAX that you will use to solve these problems.
Imitating NOT IN when filtering
One initial frustration shared by SQL developers who move to DAX is that while there is an IN operator, there is no direct NOT IN equivalent.
Fortunately, there are two solutions to this challenge that are simple and easy to apply. You can:
- Filter using
NOT …. IN. As simple as this solution is, it has left many a report developer stumped initially. - Use
EXCEPT
To begin with, suppose that you want to filter all colours but Black, Blue, and Green. This can be done using NOT … IN, as you can see in the following DAX snippet.
|
1 2 3 4 5 6 7 8 9 10 11 12 13 |
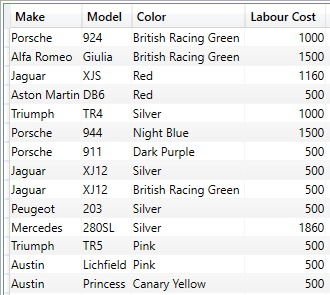
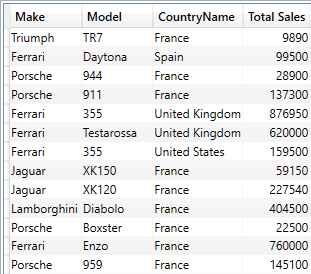
EVALUATE FILTER ( SUMMARIZECOLUMNS ( DimVehicle[Make] ,DimVehicle[Model] ,DimVehicle[Color] ,"Labour Cost", SUM(FactSales[LaborCost]) ) ,NOT DimVehicle[Color] IN {"Black", "Blue", "Green"} ) |
You can see a sample of the output from this query in the image below:
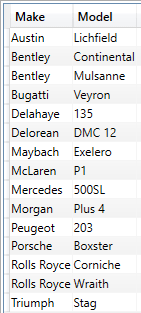
Alternatively, you can use EXCEPT to produce a similar output – with the added advantage that this approach avoids the filter column being included in the data returned to the report. What the following piece of DAX does is to create two table variables. The first contains the elements you wish to exclude, while the second contains a full dataset. The DAX then subtracts the second dataset from the first to achieve the effect of a SQL NOT IN clause.
|
1 2 3 4 5 6 7 8 9 10 11 12 13 14 15 16 |
DEFINE VAR ExceptionList = SUMMARIZECOLUMNS ( DimVehicle[Make] ,DimVehicle[Model] ,FILTER(VALUES(DimVehicle[Color]), DimVehicle[Color] = "Black" || DimVehicle[Color] = "Blue" || DimVehicle[Color] = "Green") ) VAR FullList = SUMMARIZECOLUMNS ( DimVehicle[Make] ,DimVehicle[Model] ) EVALUATE EXCEPT(FullList, ExceptionList) |
The output from this query is shown below:
When testing EXCEPT queries like this one, you can add the columns that you are filtering on (Make and Model in this example) in the output initially to test the results and ensure that the query is working as expected.
Then, of course, you remove these test columns from the query.
Removing filter columns
If you are using the FILTER() function, inevitably, the filtered column will be returned as part of the output. The initial solution is not to use any of the data columns used purely to filter the output in the paginated report. However, this will increase the quantity of data that is calculated and consequently increase the load on the Power BI Service.
A more polished approach is to wrap the output in a SUMMARIZE() function to remove any extraneous data so that you are only returning data that is used in the paginated report. You can see this approach applied to the NOT … IN filter that you saw in the previous section in the following DAX snippet:
|
1 2 3 4 5 6 7 8 9 10 11 12 13 14 15 16 17 18 |
EVALUATE SUMMARIZE ( FILTER ( SUMMARIZECOLUMNS ( DimVehicle[Make] ,DimVehicle[Model] ,DimVehicle[Color] ) ,NOT DimVehicle[Color] IN {"Black", "Blue", "Green"} ) ,DimVehicle[Make] ,DimVehicle[Model] ,"Labour Cost", SUM(FactSales[LaborCost]) ) |
The output from this query is:
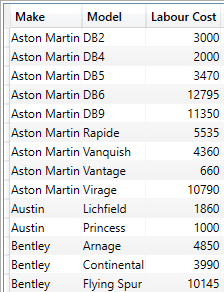
It is worth noting that you do not have to repeat any calculations (such as the Labour Cost in this example) inside the definition of the core data defined by the SUMMARIZECOLUMNS() function (although adding them here as well will not cause any effect on the output).
Custom selections in a multi-select SSRS parameter list
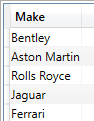
DAX can also be used to pre-select multiple elements in a multi-value parameter instead of entering them manually in Power BI Report Builder. This approach has the advantage of making the preselection code-based (and so easier and faster to update in the case of larger lists). You can see this in the following DAX snippet, which uses the DATATABLE() function. The entire piece of DAX is then used as the dataset that defines the selected values for the report parameter.
|
1 2 3 4 5 6 7 8 9 10 11 12 13 14 |
DEFINE VAR OptionList = DATATABLE( "Make", STRING, { {"Bentley"}, {"Aston Martin"}, {"Rolls Royce"}, {"Jaguar"}, {"Ferrari"} } ) EVALUATE OptionList |
The result of this simple query is a short list of chosen elements that you subsequently use in Power BI Report Builder as the data source for the pre-selected elements of the relevant parameter:
Complex OR filters
The dashboard analytics paradigm championed by Power BI is based on finer and finer slicing of data – in other words, layering AND filters that delve deeper into the data. Paginated reports traditionally deliver lists in this way but also maintain a separate tradition of using input parameters to offer alternative selections. You could define this as the OR alternative.
This is where some slightly inventive DAX can be required as, whereas it is easy to filter DAX using alternative values for a single column (or field if you prefer), it can be a little harder to deliver output from a Power BI dataset that amalgamates data where parameters can be from any of multiple fields without a cumulative filter effect. In other words, applying OR filters across several fields is a little tricker.
Multiple OR parameters – where all are compulsory
As a first use-case, imagine a business requirement where one element must be selected from each parameter list, and if any elements from either list are found, then the data must be returned to the report. In this case, to simplify matters:
- The parameter is not multi-select
- Nulls are not allowed
To make things clearer, as a practical example, you want the user to select:
- One Make (from a parameter named Make)
- One Country (from a parameter named Country)
And these will be used in the DAX filter to output all vehicles of the specific make or sold to the specified country.
The DAX should be something like:
|
1 2 3 4 5 6 7 8 9 10 11 12 13 14 15 16 17 18 19 20 21 22 23 24 25 26 27 |
DEFINE VAR Multicriteria = CROSSJOIN ( ALL(DimGeography[CountryName]) ,ALL(DimVehicle[Make]) ) VAR SelectedCriteria = FILTER( MultiCriteria , OR( DimGeography[CountryName] = @Country ,DimVehicle[Make] = @Make ) ) VAR OrOutput = SUMMARIZECOLUMNS ( DimVehicle[Make] ,DimVehicle[Model] ,DimGeography[CountryName] ,SelectedCriteria ,"Total Sales", SUM(FactSales[SalePrice]) ) EVALUATE OrOutput |
I have left the filter columns in the output from this query so that the results make it clear that the OR filter is working as expected. You do not have to deliver these columns as part of the output when delivering final production-ready reports, of course. You can see a subset of the results (where the country variable is France and the make variable is Ferrari) below:
A simple OR query works like this:
CROSSJOIN()is used to produce the Cartesian join from the fields that are used as theORparameters. These are defined as a table variable named Multicriteria.- This table variable is filtered using an
OR()function to filter on either of the two filter columns and the results are attributed to a new table variable namedSelectedCriteria. - The
SelectedCriteriatable variable is used as a filter table inside theSUMMARIZECOLUMNS()function that returns the required data.
There are a few points to note when using this approach:
CROSSJOIN()can handle more than two input tables. You can extend this filtering approach across multipleORcolumns.CROSSJOIN()can be replaced withSUMMARIZECOLUMNS()– and the latter is generally more efficient if you are creating the cartesian result of multiple columns or large datasets. Indeed, you could face a timeout if the output is of any size at all. So, I do not recommend usingCROSSJOIN()with more than two tables unless each table has no more than a handful of rows. You can see an example of usingSUMMARIZECOLUMNS()rather thanCROSSJOIN()in the following snippet of DAX:
|
1 2 3 4 5 6 7 |
VAR Multicriteria = SUMMARIZECOLUMNS ( DimGeography[CountryName] ,DimVehicle[Make] ,"Dummy", COUNT(FactSales[SalePrice]) ) |
- Remember to add a calculated column to accelerate the output of the cartesian product when using
SUMMARIZECOLUMNS()just as you would when sending output data to a paginated report.
Multiple OR filters – for single elements per filtered column
The simple OR approach that you have seen can easily be extended to handle multiple input parameters. Suppose, in this particular case, that you want to filter by any of:
- One Make
- Or One Country
- Or One Customer
This will require the following approach:
- Define each of the parameters as shown above
- Extend the
CROSSJOIN()function to encompass the Cartesian join on all the fields that will be used in the nestedOR()functions. - Extend the DAX from the previous example to using nested
OR()functions to handle more than two parameters, like this:
Specifically:
|
1 2 3 4 5 6 7 8 9 10 11 12 13 14 15 16 17 18 19 20 21 22 23 24 25 26 27 28 29 30 31 32 33 34 35 36 37 38 39 40 41 |
DEFINE VAR Multicriteria = CROSSJOIN ( ALL(DimGeography[CountryName]) ,ALL(DimVehicle[Make]) ,ALL(DimClient[ClientName]) ) VAR SelectedCriteria = FILTER( MultiCriteria , OR( OR( DimGeography[CountryName] = @Country ,DimVehicle[Make] = @Make ) ,DimClient[ClientName] = @Customer ) ) VAR OrOutput = SUMMARIZECOLUMNS ( DimVehicle[Make] ,DimVehicle[Model] ,DimGeography[CountryName] ,SelectedCriteria ,"Total Sales", SUM(FactSales[SalePrice]) ) EVALUATE OrOutput |
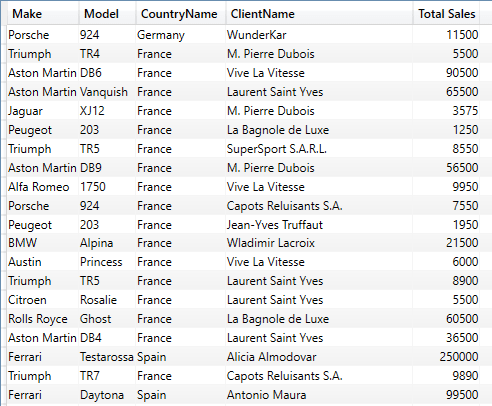
Using France as the CountryName, Ferrari as the Make and WunderKar as the ClientName, this DAX query produces the following output:
OR – with multiple inputs per parameter
A different approach is necessary if you want to apply multiple alternative filter options, and allow multiple values for each parameter. In other words, if you have multiple multi-select input parameters, then you need to adopt a slightly different solution.
Defining the parameter
The first thing to do is to handle the input from the multi-select parameter. Imagine using the same two parameters as in the previous example (Country & Make) however both are multi-select parameters this time. This implies setting up the parameter input from the paginated report with a function that will concatenate the selected values, separated by the pipe character. This means creating a function in SSRS that looks like the following code snippet:
|
1 |
=JOIN(Parameters!ParameterName.Value, "|") |
Imagine, then, that this will result in the Country and Make variables having the following contents:
- @Country contains Belgium|Switzerland|France
- @Make contains Aston Martin|Ferrari
The DAX that handles these input parameters and returns data where any of the input values from either parameter are found is the following:
|
1 2 3 4 5 6 7 8 9 10 11 12 13 14 15 16 17 18 19 20 21 22 23 24 25 26 27 28 29 30 |
DEFINE VAR InputCountry = @Country VAR InputMake = @Make VAR Multicriteria = SUMMARIZECOLUMNS ( DimGeography[CountryName] ,DimVehicle[Make] ,"Dummy", COUNT(FactSales[SalePrice]) ) VAR SelectedCriteria = FILTER( MultiCriteria , OR( PATHCONTAINS(InputCountry, DimGeography[CountryName]) ,PATHCONTAINS(InputMake, DimVehicle[Make]) ) ) VAR OrOutput = SUMMARIZECOLUMNS ( DimVehicle[Make] ,DimVehicle[Model] ,DimGeography[CountryName] ,SelectedCriteria ,"Total Sales", SUM(FactSales[SalePrice]) ) EVALUATE OrOutput |
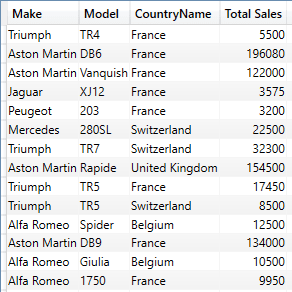
The output returned from this query is the following:
The main difference between this approach and the previous technique is that PATHCONTAINS() is used instead of a simple equality operator. This allows the DAX to filter on the multiple elements contained in each input parameter. This code snippet also shows that you can pass the contents of a paginated report variable directly to a DAX variable.
Multiple OR parameters – where none are compulsory
As a second example of an OR filter challenge, imagine that you want to extend the previous OR query but that you do not want to make any of the parameters compulsory, and each parameter can nonetheless contain potentially multiple elements to filter on. Here the challenge arises because paginated reports do not allow for multi-select variables that can also allow NULLs.
The classic solution to this challenge is to add a <No Selection> element to the list of parameters. In essence, you must add to each parameter list a value that is not actually present in the field that will be used as a filter. You then allow the possibility of passing this value back as a filter criterion. As you are applying an OR filter, the additional value that you are adding is not present in the data, and it will have no effect on the output. You can even set this value as the default for the relevant parameter.
This is a two-stage process. Firstly, you need to add a <No Selection> (or any term that is not found in the data) element to the parameter list. Secondly, you need to create a multiple OR filter as you saw previously.
Adding <No Selection> to the parameter list
The following short piece of DAX is one way to add an added element to a parameter list. This is used to populate the multi-select parameter in SSRSDEFINE
|
1 2 3 4 5 6 7 8 9 10 |
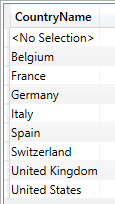
DEFINE VAR MainList = SUMMARIZECOLUMNS ( DimGeography[CountryName] ) VAR NoSelectElement = {"<No Selection>"} EVALUATE UNION(MainList, NoSelectElement) ORDER BY DimGeography[CountryName] |
The output (that you will see in a parameter list) is the following:
You can then use the DAX that you saw previously (using the Selectedcriteria and MultiCriteria table variables) to filter the output data. Even if <No Selection> is passed as an input parameter, as this is an OR filter, <No Selection> value that is passed in as a parameter element will have no effect on the output.
A couple of points are worth noting here:
- The variable
NoSelectElementis a table containing a single row of data – all created using the DAX Row Constructor. ORDER BYuses the data lineage of the first table in theUNION()function to specify the field to sort on.
Using a comma-delimited list of input values to filter the output
Although most users apply filters to narrow down the output data in a report, it is also possible to enter lists of data into a paginated report parameter to specify a precise set of output records. This approach has known limitations- most notably that there is a limit to the number of elements that can be entered as a delimited list in a report variable. Nonetheless, I have seen this kind of approach used on many occasions, so it is worth explaining here.
As far as the DAX is concerned, the credit for the following code snippet goes to a superb piece of DAX by Chris Webb that I have very slightly tweaked to adapt to suit the requirements of Paginated Report input. You can find his original code here (where the concepts behind the core DAX are explained).
What this DAX does is to take a comma-delimited string of text elements and:
- Replaces the commas with vertical bars.
- Creates a table of the text elements (this is the clever bit).
- Uses this table as a filter inside a
CALCULATETABLE()function.
Of course, the choice of the delimiter character is up to you. All you have to do is to enter the delimiter as the second element inside the SUBSTITUTE() function.
The code snippet is the following:
|
1 2 3 4 5 6 7 8 9 10 11 12 13 14 15 16 17 18 19 20 21 22 23 24 25 26 27 28 29 30 31 32 33 |
DEFINE VAR InputList = @InputListOfElements VAR NewInputList = SUBSTITUTE( InputList , ",", "|" ) VAR CaseCount = PATHLENGTH (NewInputList) VAR NumberTable = GENERATESERIES(1, CaseCount, 1) VAR CustomerTable = GENERATE ( NumberTable, VAR CurrentKey = [Value] RETURN ROW ("Key", PATHITEM (NewInputList, CurrentKey)) ) VAR GetKeyColumn = SELECTCOLUMNS (CustomerTable, "Key", [Key]) VAR FilterTable = TREATAS (GetKeyColumn, DimCLient[CustomerID]) EVALUATE CALCULATETABLE( SUMMARIZECOLUMNS( DimCLient[ClientName] ,DimVehicle[Make] ,DimVehicle[Model] ,"Sales", SUM(FactSales[SalePrice]) ) ,FilterTable ) |
The major challenge here is the (undocumented) limitation on the number of characters that a paginated report variable will accept. I estimate this to be around 11,000 characters approximately. So, should you need to parse longer lists, the solution is to use several input parameters in SSRS. The multiple input parameters are then combined into one variable in the DAX that returns the final output. This can be done in DAX using a simple concatenation of DAX variables rather like the example below:
|
1 2 3 4 5 |
VAR INP01 = @Param01 VAR INP02 = @Param02 VAR INP03 = @Param03 VAR InputList = INP01 & "," & INP02 & "," & INP03 |
Alternatively, you can combine the variables using SSRS code by setting the input variable for the dataset as a function using code like the following:
|
1 |
=Parameters!Param01.Value & IIF(IsNothing(Parameters!Param02.Value), "", "," & Parameters!Param02.Value) & IIF(IsNothing(Parameters!Param03.Value), "", "," & Parameters!Param03.Value) |
While going beyond the classic approaches to reporting, this simple evolution of paginated report parameter selection opens up a range of possibilities for report data selection.
Pass RSCustomDaxFilter output to a table variable
One frustrating limitation to the RSCustomDaxFilter function is that it cannot be used twice with the same input variable inside the same DAX code block. Yet there will inevitably be times when you need to reuse the multiple filter elements to shape certain data outputs. One solution to this challenge is to use RSCustomDaxFilter to populate a table variable. This table variable can then be reused as a filter table inside a CALCULATETABLE() function. Indeed, you may prefer this technique as a coding approach for its elegance and versatility, even if you only need to use the elements in a multi-value parameter in DAX.
You can see this approach applied in the following short piece of DAX:
|
1 2 3 4 5 6 7 8 9 10 11 12 13 |
DEFINE VAR FilterTable = SUMMARIZECOLUMNS( RSCustomDaxFilter(@Make,EqualToCondition,[DimVehicle].[Make],String) ) EVALUATE CALCULATETABLE( SUMMARIZECOLUMNS( DimCLient[ClientName] ,DimGeography[CountryName] ) ,FilterTable ) |
You need to be aware that this code snippet will not run in DAX Studio as the RSCustomDaxFilter() function is specific to SSRS. So you will have to test it inside a real SSRS report created using Power BI Report Builder.
Alternative input
One paginated report UI requirement that surfaces fairly frequently is the capability to allow the user to select the actual parameter (and not the parameter contents) that can be used inside a query. In other words, you want to use a single query to produce different outputs depending on a user selecting one of several potential input parameters. I have seen this most frequently in cases where multiple date parameters are displayed in an SSRS report, and one date only must be specified to be used as the basis for a filter.
In this example, however (given the simplicity of the sample dataset), assume that, instead of using dates, the colour and make parameters are passed to the DAX query along with a third parameter that indicates which of these two initial parameters should filter the output.
To resume, the available parameters that are defined in the report are:
InputSelector– The choice of which parameter will be applied (colour or make)Colour– the list of colours to filter onMake– The list of makes to filter on
The actual DAX is shown immediately below, with the explanation afterwards.
|
1 2 3 4 5 6 7 8 9 10 11 12 13 14 15 16 17 18 19 20 21 22 23 24 25 26 27 28 29 30 31 32 33 34 35 36 37 38 39 40 41 42 43 44 45 46 |
DEFINE VAR InputSelector = @InputSelector VAR ColourChoice = @Colour VAR MakeChoice = @Make VAR CoreTable = SUMMARIZECOLUMNS ( DimGeography[SalesRegion] ,DimGeography[CountryName] ,DimVehicle[Make] ,DimVehicle[Color] ,"Total Sales", SUM(FactSales[SalePrice]) ,"No. Sales", COUNT(FactSales[SalePrice]) ) VAR SelectedColour = ADDCOLUMNS( FILTER( CoreTable ,DimVehicle[Color] = ColourChoice ) ,"TableSelector", "Colour" ) VAR SelectedMake = ADDCOLUMNS( FILTER( CoreTable ,DimVehicle[Make] = MakeChoice ) ,"TableSelector", "Make" ) VAR OutputData = SUMMARIZE ( FILTER ( UNION(SelectedColour, SelectedMake) ,[TableSelector] = InputSelector ) ,DimGeography[SalesRegion] ,DimGeography[CountryName] ,DimVehicle[Color] ,"Total Sales", SUM(FactSales[SalePrice]) ,"No. Sales", COUNT(FactSales[SalePrice]) ) EVALUATE OutputData |
Running this code in DAX studio will display the Query Parameters dialog-where I have entered:
- Colour as the parameter to use in the query
- Red as the colour (this will be used to filter the output)
- Ferrari as the make (this will not be used in to filter the output)
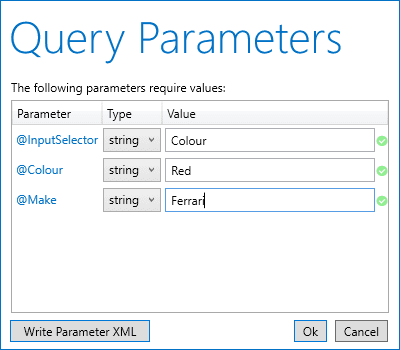
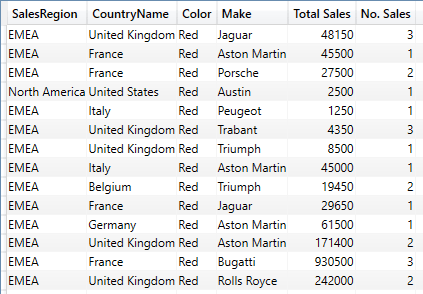
Using these parameter settings only returns red cars-whether they are Ferraris or not, as you can see below.
How it works:
- The SSRS variables are passed to DAX variables.
- A table variable is created containing the required (unfiltered) output data. This table contains the two columns that could be used to filter data.
- Two table variables (
SelectedColourandSelectedMake) are created, each of which extends the initial table variable with ad added column containing the filter type (colour or make) that was used to filter the contents of the table variable. - The two filtered table variables are
UNIONedinto a fourth table variable. This table is filtered (using the added column) only to display the output using the chosen parameter type.
Notes:
- When the
TableSelectorcolumn (that is added to the table variablesSelectedMakeandSelectedColour) is used to filter the finalOutputDatatable variable, the column name must be in square brackets inside theFILTER()function. - The
SUMMARIZE()function is only required to remove the filter columns. If you want to keep the filter columns in the output, then you can remove theSUMMARIZE(). - Alternatively, it is possible to create multiple datasets instead (one for each filter type) and have multiple tables for the output in the report – and then use the selector variable to control the visibility of objects in the actual report. However, this approach entails data being sent to the report from two or more queries – and this can be voluminous. Moreover, this alternative approach rapidly makes for a complex report if there are multiple visuals that use the alternative output data.
- It is, of course, possible to have more than two alternative filters. All you have to do is to create multiple table variables (one for each of the alternative selections) then nest
UNION()functions to aggregate all data into theOutputDatatable.
Final comments
While it is clearly impossible to cover every DAX challenge that you will face when developing paginated reports based on a Power BI dataset, there are some limitations that you need to be aware of – particularly before promising your clients or bosses a failsafe reporting solution.
Large dataset output
It is fair to say, at risk of extreme generalisation, that Power BI and DAX are designed to aggregate and resume data rather than deliver large amounts of list-based data to users. Consequently, you need to be aware that very wide and deep paginated reports could simply overload the Power BI service and cause timeouts.
Clearly, the definitions of what defines a “wide and deep” report are open to discussion. Equally, much will depend on the resource level that you have chosen and the stress placed on the Power BI Premium service by multiple simultaneous user requests (for dashboards and paginated reports), as well as any system configuration tweaks that you have carried out.
Nonetheless, there are limits on the amount of data that can be returned using paginated reports in Power BI, and it is important not to attempt to use an SSRS-like approach to use the Power BI service as a data export and delivery vehicle.
Large parameter list input
The paginated report interface does have its limits as far as the number of elements that can be selected from a multi-value parameter list. While no one seems to know the exact value, it’s obvious when it has been reached because a report stops functioning correctly. This is something else that has to be lived within paginated reports. The only real solutions are to apply interface tweaks such as having a hierarchy of parameters where selecting one parameter restricts the selection in a second parameter – and so on. This equates to the Power BI dashboard technique of using hierarchical slicers.
Conclusion
In this article – along with the previous articles – you have learned the core approaches needed to use DAX effectively to query Power BI datasets for paginated reports. You can now deliver these reports either as stand-alone elements accessed from Power BI workspaces (or, better still, from the Power BI App) or embedded in Power BI dashboards using the paginated report visual.
You now have, in a single platform, a wide-ranging series of options to deliver the data that your users require both as dashboards and as list-style reports. Moreover, all the varied output styles can be created from a single source of data – a Power BI data model.