
Structure of the article series
Before we get started digging into the internals and components making up the Query Store, I want to describe how this article series is structured. The following aspects of the Query Store will be covered by the article series.
- The SQL Server 2016 Query Store – Part 1: Overview and Architecture
This is the part of the series you are reading right now. After a short overview of the Query Store features and use-cases, we will be taking a look at the Query Store Architecture and end the article describing the various Query Store configuration options and how you can enable it. - The SQL Server 2016 Query Store – Part 2: Built-In Reporting
In this article I will describe the build-in Query Store reports, what they show and the options we have to modify their results. - The SQL Server 2016 Query Store – Part 3: Accessing Query Store Information Using DMVs
This article dives a bit deeper into the DMVs that are related to the Query Store. What information is available in the different DMVs and how can we use that information to write custom reporting or queries. - The SQL Server 2016 Query Store – Part 4: Forcing Execution Plans Using the Query Store
In part four we will use the Query Store to force specific Execution Plans to be used when a query executes. We also spend some time looking at plan regression, why it is bad and the options we have to avoid it. - The SQL Server 2016 Query Store – Part 5: Analyzing Query Store Performance
Enabling the Query Store on your database can potentially have an impact on the performance of your database. In part six we will describe the methods we can use to analyze the performance of the Query Store and the impact it has on your system.
Introduction
Once the first Community Technology Preview (CTP) of SQL Server 2016 was released, we were finally able to play around with, what is, in my opinion, one of the most anticipated new features: The Query Store.
The Query Store is a feature that can help us to troubleshoot query performance, as well as capturing query execution information, such as the number of executions or the average duration of a query. The Query Store also captures every Execution Plan that has been generated for a specific query and you can then decide what Execution Plan you want SQL Server to use for that specific query.
Some common uses for the Query Store are described by Microsoft as follows:
- Quickly find and fix a plan performance regression by forcing the previous query plan. Fix queries that have recently regressed in performance due to execution plan changes.
- Determine the number of times a query was executed in a given time window, assisting a DBA in troubleshooting performance resource problems.
- Identify top n queries (by execution time, memory consumption, etc.) in the past x hours.
- Audit the history of query plans for a given query.
- Analyze the resource (CPU, I/O, and Memory) usage patterns for a particular database.
Even though it is already possible for us to perform many of the same actions as the Query Store in earlier SQL Server versions, capturing specific query runtime performance counters or forcing Execution Plans is a complex, specialized, task. The Query Store makes these actions far easier to use and available to everyone without needing to rewrite any queries.
As a quick overview, these are some of the advantages of the Query Store:
- The Query Store is integrated directly in SQL Server, this means that it can capture query runtime information directly at the source level;
- Without the Query Store we frequently depend on the Plan Cache, where Execution Plans are stored in-memory, when we need to analyze query Execution Plans. However, if a SQL Server restart occurs then all the Execution Plans will be removed from the Plan Cache and we are forced to start over again. The Query Store, instead, stores the information it captures on disk, which means that a SQL Server restart doesn’t affect any information that has been captured in the Query Store;
- The Query Store can be enabled on an individual database;
- A large amount of information is directly available through built-in Query Store reports;
All the information inside the Query Store can also be accessed through Dynamic Management Views (DMVs) which opens the door for custom reporting and/or alerting.
We will take a thorough look at some of the various advantages I mentioned above, and more, further on in this series of articles.
Another bonus I want to mention before we continue, is that the Query Store will be available in all editions of SQL Server! So no “Enterprise-only” this time!
Finally, it is important to understand that the Query Store is a complete new feature inside SQL Server 2016, which is only available as a preview version at the time of writing these articles. This means that information inside the articles can change when SQL Server 2016 is officially released. Personally I don’t think this is very likely at the moment, seeing how the Query Store functionality remained stable during the various CTP versions, but I’m obliged to give a warning.
Query Store Architecture
So how does the Query Store work underneath the hood? The following figure shows the basic architecture of the Query Store.
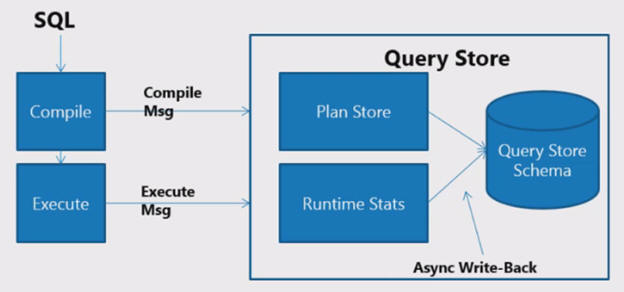
Figure 1 Query Store architecture (Conor Cunningham, used with permission)
What you can see in the figure above is that the Query Store consists of actually two “stores”, the Plan Store and the Runtime Stats Store. Both these stores are in-memory objects that hold query information.
When a query gets submitted against a database that has the Query Store enabled, the compiled query Execution Plan is written to the Query Store Plan Store and the runtime information of the query is recorded in the Runtime Stats Store. As said before, this information is stored initially in-memory. After a specific interval the information inside the in-memory stores is asynchronously written to disk to harden the information. The Query Store writes the Execution Plans and runtime statistics into the primary filegroup of the database that you queried against.
By hardening the Execution Plans and runtime statistics to disk, the information inside the Query Store is not lost whenever a SQL Server restart occurs. This is more valuable than analyzing the Execution Plans inside the Plan Cache, since the Plan Cache will be empty again whenever a SQL Server restart occurs. The same goes for the sys.dm_exec_query_stats DMV, which is frequently used to analyze query runtime information. This DMV will also be reset after a SQL Server restart. The interval at which the Query Store flushes data to disk can be configured but, flushing more often comes at a performance cost. By default the flush to disk interval is set to 15 minutes, this will result in an average performance overhead of 3-5% when you enabled the Query Store. The lower the interval, the higher the impact on performance. New Execution Plans that are first seen by the Query Store will be flushed to disk more aggressively than Execution Plans that already exist inside the Query Store. When enabling the Query Store or the first time, or after purging it, it is common to see flushes occur more often since more new Execution Plans are encountered.
So how does the Query Store access data from disk and in-memory simultaneously when we query either the Query Store reports or access the DMVs? To make this possible with the least amount of performance impact a new Table Defined Function (TDF) was developed that grabs data still in-memory while simultaneously grabbing the data that was already persisted on disk. Figure 2 below shows the Execution Plan of a query against one of the new Query Store DMVs. In this figure you can see the TDF (QUERY_STORE_RUNTIME_STATS_IN_MEM) that grabs the in-memory data and a Clustered Index Scan on plan_persist_runtime_stats that collects the data from disk.
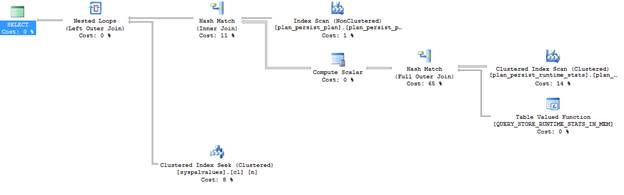
Figure 2 Gathering Query Store data from memory and disk
Now that we have looked at bits of the architecture of the Query Store, let’s get our hands dirty and take look at the configuration options available to us for the Query Store.
Examining Query Store Options
Before we can dive into the details about all the different knobs we can turn for the Query Store, we will first have to enable it on a database. For this article series I downloaded the AdventureWorks2014 database from http://msftdbprodsamples.codeplex.com/ and restored it on my SQL Server 2016 Instance.
There are two methods we can use to enable the Query Store on a database, using the GUI inside SQL Server Management Studio (SSMS), or by using T-SQL.
If we want to use the GUI to enable the Query Store we only need to go to the “Query Store” options inside the database properties as shown in Figure 3 below.
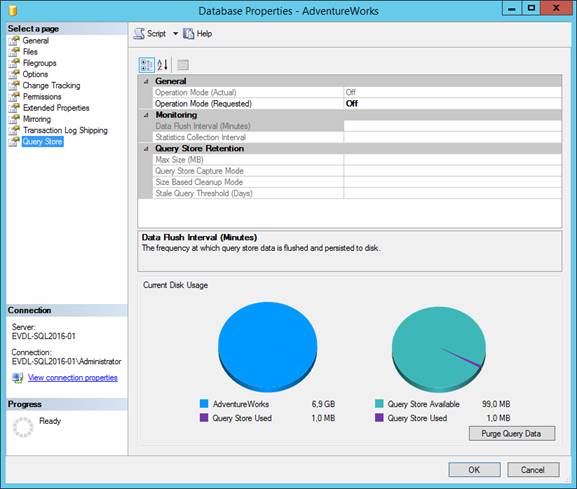
Figure 3 Query Store properties
By changing the “Operation Mode (Requested)” option from Off to Read Write we can enable the Query Store and allow it to capture query Execution Plans and runtime information.
Enabling the Query Store using T-SQL is just as easy. The query below will enable the Query Store for the AdventureWorks database I use on my demo machine.
|
1 |
ALTER DATABASE AdventureWorks2012 SET QUERY_STORE = ON; |
Now that we have the Query Store enabled, let’s take a look at some of the options we have to configure its behavior.
The first option “Operation Mode (Actual)” cannot be changed since it only indicates the current mode of the Query Store. The value can be either Off, Read Write or Read. When the Query Store has a mode of Read no new Execution Plans or query runtime statistics will be collected.
The options “Operation Mode (Requested)” can also be set to the same values as the previous option. Changing this option like we did when we enabled the Query Store directly changed the operation mode of the Query Store.
The “Data Flush Interval (Minutes)” allows you to set the interval how quickly the collected Execution Plans and query runtime statistics are being flushed from memory to disk. By default this option will be set to 15 minutes. Changing the interval to a lower value means Query Store information inside the memory of your SQL Server Instances will be written to disk faster, this can have a negative impact on the performance of your Instance. Setting the value to a higher interval means memory flushes occur less, but it also means more Query Store information that resides in memory will be lost when a SQL Server restart occurs. In most cases the default value of 15 minutes will suffice. However, if you experience performance degradation by the frequent flushing of the Query Store memory to disk you can choose to increase the interval (we will dig deeper into Query Store performance at a later point in the article series).
“Statistics Collection Interval” allows you to configure yet another interval. This one allows you to configure the level of granularity of the collected query runtime statistics. By default it is set to 1 hour. Basically this means that it set the aggregation interval of query runtime statistics inside the Query Store. The lower the value of this option the finer the granularity of the runtime statistics becomes, but this also means that more intervals occur and thus more space is required to store the query runtime statistics on disk.
The “Max Size (MB)” option allows you to configure a maximum size for the Query Store. By default this value is set to 100MB. One important thing to remember is that data inside the Query Store is stored inside the Primary Filegroup of the database that has the Query Store enabled. Changing the option to a higher value will allow you to store more Query Store data but it also means your database will grow larger. Whenever the Query Store hits the maximum size configured by this option it’s Operation Mode will automatically switch to Read-only and no new data will be collected.
The “Query Store Capture Mode” option makes it possible to filter out queries with very low execution times or execution counts. By default the option is set to All which means every query executed against the database will be recorded in the Query Store. By setting the option to Auto the Query Store will filter out insignificant queries. What queries are filtered is determined by an internal process and we do not have any influence on it. The final value for this option is None which means no new Execution Plans or query runtime statistics are captured.
“Size Based Cleanup Mode” can be configured to automatically let the Query Store clean up data when it reaches 90% of the maximum Query Store size you configured in the “Max Size (MB)” option. The cleanup will remove the oldest and least expensive query data and stops the cleanup at 80% of the “Max Size (MB)” value. By default this option is set to Off. Setting it to Auto will enable the automatic cleanup.
The final option, “Stale Query Threshold (Days)” sets how long query data is retained inside the Query Store. By default the setting is configured to 367 days. The value of this option should reflect your historic analysis needs. If you don’t need to store query information for 376 days but for a shorter period of time it is advices to lower this option so you are not wasting space inside the Query Store for data you will never use.
Besides setting all the options through the Query Store GUI, you can also configure all of these options through T-SQL. The table below shows all of the Query Store options we discussed above and shows the corresponding T-SQL command. The table also shows one additional option which you cannot configure through the GUI (yet), MAX_PLANS_PER_QUERY. By default this option is set to 200 which means the Query Store will store a maximum of 200 Execution Plans per query.
|
GUI Option |
T-SQL Option |
|
Operation Mode (Requested) |
OPERATION_MODE |
|
Data Flush Interval (Minutes) |
DATA_FLUSH_INTERVAL_SECONDS |
|
Statistics Collection Interval |
INTERVAL_LENGHT_MINUTES |
|
Max Size (MB) |
MAX_STORAGE_SIZE_MB |
|
Query Store Capture Mode |
QUERY_CAPTURE_MODE |
|
Size Based Cleanup Mode |
SIZE_BASED_CLEANUP_MODE |
|
Stale Query Threshold (Days) |
CLEANUP_POLICY (STALE_QUERY_THRESHOLD_DAYS) |
|
|
MAX_PLANS_PER_QUERY |
Changing Query Store options through T-SQL can be achieved using the following command:
|
1 2 3 4 5 |
ALTER DATABASE [db_name] SET QUERY_STORE ( [Query Store options] ); |
For example, to change the maximum storage size to 250MB of the Query Store on the AdventureWorks database you can use the following T-SQL command:
|
1 2 3 4 5 |
ALTER DATABASE AdventureWorks SET QUERY_STORE ( MAX_STORAGE_SIZE_MB = 250 ); |
We can also issue multiple configuration changes at once, in the example below we change the Query Store size of the AdventureWorks to 250MB, change the Size Based Cleanup Mode to Auto and retain 30 days of query data.
|
1 2 3 4 5 6 7 |
ALTER DATABASE AdventureWorks SET QUERY_STORE ( MAX_STORAGE_SIZE_MB = 250, SIZE_BASED_CLEANUP_MODE = AUTO, CLEANUP_POLICY = (STALE_QUERY_THRESHOLD_DAYS = 30) ); |
One final option I would like to highlight is the ability to empty, or purge, all the data inside the Query Store. You can either do this through the Query Store properties window inside SSMS by clicking the “Purge Query Data” button in the bottom right, or by using the T-SQL command below.
|
1 |
ALTER DATABASE [db_name] SET QUERY_STORE CLEAR; |
Now that we know how we can enable and configure the Query Store through either the GUI or T-SQL, we will take a look at some of the build-in Query Store reporting available through SQL Server Management Studio in the next article: Introducing the SQL Server 2016 Query Store #2 – Query Store Build-in Reporting.