Why bother with MongoDB? Although MongoDB is not yet, to my eye, an obvious choice for processing enterprise-level data, it has a useful role in the enterprise. It can be a powerful tool for automating the process of getting hold of data and transforming it into a form that can then be consumed easily by reporting tools or for updating data in a relational database. It can be a useful adjunct to scripting.
In this article, I’ll be showing how to achieve this, using an open-data example. MongoDB’s obvious attraction is that it can read document data in JSON or BSON: it can even ingest CSV. It allows you to do a wide range of transformations of document data containing objects and arrays, far more than is possible with SQL Server alone.
Hands-on Approach to Getting Started
There are a number of third-party tools that allow you to manipulate and use MongoDB without having to engage in a lot of learning. For me, the equivalent to SSMS is Studio3T. You can get most of what you initially want by judicious clicking. It allows you to use SQL to generate mongo shell queries for reasonably simple joins and grouping aggregations. Its Aggregation editor is a lifeline because it allows development of complex pipelines to be done in easy steps. At some stage, however, once you’ve developed MongoDB queries and aggregations, you’ll want to supplement this with some form of automation processes. It could be that you want an automated data feed, or a system for collecting performance baselines. You may need to do routine reports or graphics. You will need some sort of processes that will test data, sequence MongoDB code and execute such code conditionally.
MongoDB itself comes with several command line-interface tools which allow for easy automation. In this article, we’ll just get started by using the part of MongoDB shell that provides a JavaScript API for database operations. The shell also provides higher-level commands that are not JavaScript, that are geared for admin: administrating roles, users, and logs. To run queries and get all the information that we want about database objects, we need the JavaScript Shell.
If you are using MS Windows, then you’ll generally want to use PowerShell. With PowerShell, you have several choices for automating MongoDB. You can use a module to do the work for you, you can use ODBC with a suitable driver, you can use the C# interface, or you can use MongoDB.exe. If you need to do asynchronous queries or anything elaborate, then consider the C# interface, but I like a simple life, am not too bothered about small performance issues, and I like the comfort of knowing that my interface is always up-to-date, so I use the command-line interface.
Installing MongoDB.
MongoDB is best installed on its own server, but it is happy with a reasonably-sized PC. The more memory you can provide it, the happier it is. However, if you install it on your slow workstation or laptop, you will be more attuned to performance issues and keener to deal with them. I usually use Chocolatey to install MongoDB and Studio3T, and I use it to subsequently keep my MongoDB instances up-to-date.
|
1 2 |
choco install studio3t -y choco install mongodb -y |
At the time of writing, Version 4 is out and features a proper windows installer. This is not yet on Chocolatey, so you would need to download the installer from the MongoDB site. There are instructions in the Install MongoDB Community Edition. I don’t want to repeat these here as they may change over time.
For the details of how to install MongoDB on a Windows server with authentication, I’ve written an article with my advice on how to go about it.
There is a good introduction to getting started with MongoDB for Windows here MongoDB Basics for .NET by Example which gives more detail.
The database server can be started using MongoD.exe or run as a service, again using MongoD.exe. To start from PowerShell, navigate to the MongoDB Bin directory and run this command:
|
1 |
.\mongod.exe |
To prevent the MongoDB database server from shutting down, keep this window open and launch a new PowerShell window to follow along with the rest of the article. MongoDB can be alternatively run as a service. (instructions in the link) If you run it on a server as a service and wish to access it across a network, you will need to ensure that there is access to the port you select
|
1 2 3 4 5 6 7 |
<# Cut a hole in the firewall for the designated port #> New-NetFirewallRule <#now allow it through the firewall #> ` -DisplayName "Allow MongoDB" ` -Direction Inbound ` -Protocol TCP ` -LocalPort $MongoPort ` -Action Allow |
Where $mongoport is the port you choose – usually 27017. You will also need to set the –bind_ip_all parameter in mongod.exe to allow it to respond to all the network cards on the server. This server-based installation requires authentication but setting this up is outside the scope of this article. I give instructions here.
Using PowerShell
We’ll assume that you’ve got MongoDB installed in the C:\Program Files\MongoDB\Server\ directory and you are using version 4.0. Obviously, the version will change over time. Run this code to set the directory and alias. Using this trick will allow the MongoDB commands to behave a bit like PowerShell cmdlets.
|
1 2 3 4 5 |
<#The default MongoDB Community Edition location #> $mongoDirectory='C:\Program Files\MongoDB\Server\4.0\bin' Set-Alias mongo "$mongoDirectory\mongo.exe" #so we can test it out mongo --help |
This will display the basic command-line options and parameters for the Mongo CLI.
Let’s just create a database, create a collection within that database, and finally insert some data into the collection. Having done that, we find what we selected and bring it back to the client. We’ll use shell methods to achieve this. We will start out by assuming that we have not yet set up authentication and are using the local server. We could do it all in one script, but let’s not get carried away yet. We will blithely assume that everything goes well
|
1 2 3 4 5 6 7 8 |
# create the database by first accessing it .... $db = (mongo --quiet --eval "dbnew=db.getSiblingDB('deleteMe')") # ... and now creating a collection (normally we'd want to create collations etc) mongo $db --quiet --eval "db.createCollection('sample');" # write a document to the collection we have just created mongo $db --quiet --eval "db.sample.save( { 'item': 'book', 'qty': 40 } )" #return the resulting document as a BSON document string mongo $db --quiet --eval "db.sample.find().pretty().shellPrint()" |
This should have returned …

We ought to tidy this up a bit.
For a start, once you get beyond accessing MongoDB on the same machine, then you’ve got a lot more parameters to specify. Now, it is likely that we will want to use a network-hosted MongoDB server that has authentication. We might even be using an encrypted connection if we are using a cloud-based server. You have your credentials (–username, –password and –authenticationDatabase) , the host name (–host), the port it uses (–port), the specification of the TLS/SSL and so on. Soon, you end up with a mess of detail for the connection. Fortunately, there are two solutions. You can connect to the host via a connection string that contains all the connection information, or you can splat.
First set up your details
|
1 2 3 4 |
$MongoPort=27017 #TCP port 27017 is the default port used by MongoDB. $Mongohost='MyServer' $Admin='Admin' $AdminPassword='MyAdminPassword' |
We can set up a connection string and use it with Mongo
|
1 2 3 |
$connectionString="mongodb://$($Admin):$($AdminPassword)@$($Mongohost):$($MongoPort)/admin?readPreference=primary" mongo --quiet --host $connectionString --eval "db.adminCommand('listDatabases')" |
We can also do an array splat.
|
1 2 3 4 5 6 7 |
<a id="post-80208-_Hlk520216301"></a>$p=@('--quiet', '--host',"MyMongoHost", '--port'," ", '-u',"`"$Admin`"", '-p',"`"$AdminPassword`"", '--authenticationDatabase','"admin"', '--eval') |
Now, we can use mongo much more tidily:
|
1 2 3 |
# ensure that the admin password works $Databases=(mongo @p "db.adminCommand('listDatabases')")|ConvertFrom-JSON $Databases.databases|format-table |
You can alter values on the fly, though this is unlikely to be necessary. Here we change the port value
|
1 |
$p.IndexOf('--port')|foreach{if ($_ -ne -1){$p[$_+1]='12234'}} |
If you don’t have any security, then leave out those parameters
|
1 2 3 4 5 |
<a id="post-80208-_Hlk520216381"></a>$p=@('--quiet', '--host',"MyMongoHost", '--port'," ", '--authenticationDatabase','"admin"', '--eval') |
And if you are also using your local workstation then you don’t even need the –host parameter.
|
1 2 3 4 |
$p=@('--quiet', '--port'," ", '--authenticationDatabase','"admin"', '--eval') |
The other thing we need to do is to put in some error handling.
Some shell functions return a JSON string that tells you how it did. We can read this in PowerShell to create native PowerShell objects so we can check the status. Also, we would rather like to save the BSON (binary JSON) result as a native PowerShell object.
That ObjectId() wrapper isn’t JSON, but BSON. It has extra functions that tell us what datatype the value is. It can’t be parsed by ConvertFrom-JSON. The same is true of Date() and ISODate() functions embedded in the BSON(). We can heave out the ObjectId() with a simple regex. If we wanted to strip out all three functions we’d want to use the slightly more complicated regex replacement which would use syntax like this….
|
1 |
$result = $subject -ireplace '(NumberInt\(|ObjectId\(|ISODate\(|Date\(|NumberLong\()(?<innerds>["]?[\w\.:\-\+]{1,50}["]?)\)', '${innerds}' |
So here is our improved code, showing how the ireplace is used. To avoid an error if you have already created the database and collection, you can rename them as needed.
|
1 2 3 4 5 6 7 8 9 10 11 12 13 14 15 16 17 |
# create the database by first accessing it .... $db = (mongo @p "dbnew=db.getSiblingDB('deleteMe')") # ... and now creating a collection (normally we'd want to create collations etc) $success = (mongo $db @p "db.createCollection('sample');") | ConvertFrom-JSON if ($success.ok -ne 0) # if that went well ... { # write a document to the collection we have just created mongo $db @p "db.sample.save( { 'item': 'book', 'qty': 40 } )"; #and now read it back out $result = ((mongo $db @p "db.sample.find().pretty().shellPrint()") ` -ireplace 'ObjectId\("(?<innerds>[\w]{1,50})"\)', '"${innerds}"') | ConvertFrom-JSON } else #save the resulting document as a PowerShell object { write-warning $success.errmsg } $result #and display what we got back |

We can now check to see what databases we have, and what collections and views are present in each database.
|
1 2 3 4 5 6 7 8 9 10 11 |
#OK, lets list our databases $DatabaseCollection = @() ((mongo @p "db.adminCommand('listDatabases')") | ConvertFrom-JSON).databases | foreach{ $This = @{ }; $This.DatabaseName = $_.name; $This.Collections = (mongo $_.name @p 'db.getCollectionNames()' | ConvertFrom-JSON); $DatabaseCollection += $This } $DatabaseCollection |
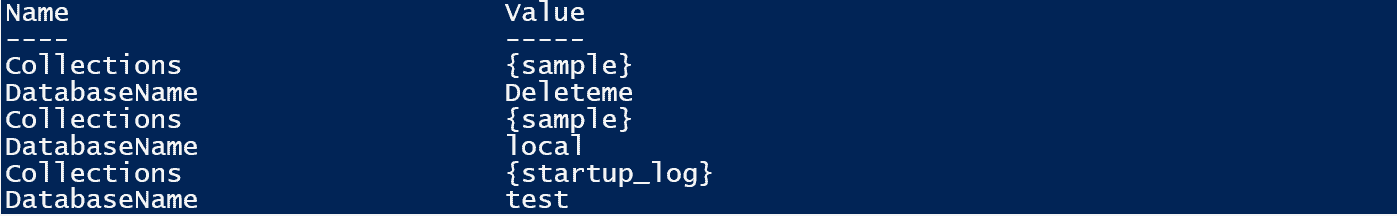
And it is easy to see what is there. To see the information in JSON format, run:
|
1 |
$DatabaseCollection|ConvertTo-JSON |
Preparing a Database
In order to demonstrate the basics, we’ll use a real database. Particularly when dealing with database performance, nothing works as well as real data of a real size.
I wanted a database that provided a good learning potential and had plenty of data. Human nature being what it is, the open data police records are perfect for databases of a reasonable size. It is ideal as a practice database because it has a number of interesting details, including location data. I was interested to find out much more of the detail of the trends in crime in Chicago, so I downloaded the Chicago database of crimes from 2001 to the present provided by the Chicago police department.
Crime levels were steeply on the decline in Chicago, and I wanted to find out more of the detail. Were all types of crime in decline or were we just seeing fewer of the more common crimes such as theft? Was there any truth in the idea that crimes increased significantly on particular days of the week?
The data can be accessed from this page …
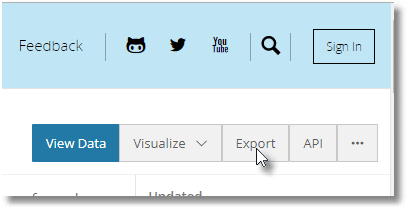
… by clicking this link.
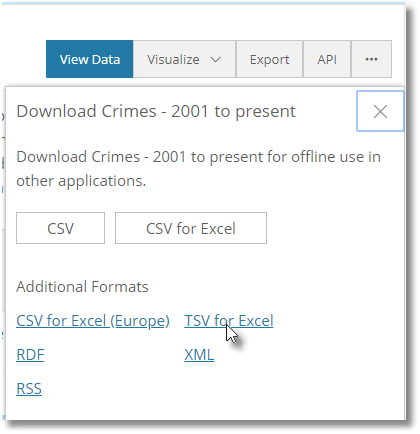
The MongoImport utility can import data in Extended JSON, CSV, or TSV. Tab-Separated format is probably the safest. We’ll create the Crimes database and a staging collection. Then we’ll stock the staging collection with the data (replace the path to the file, of course).
|
1 2 3 4 5 6 7 8 9 |
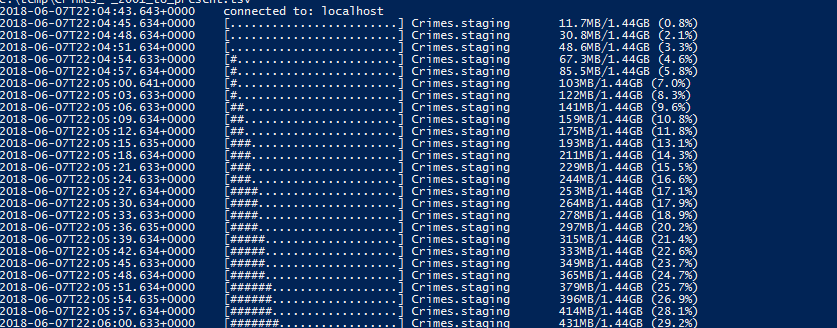
Set-Alias MongoImport "$mongoDirectory\mongoimport.exe" #set this to the location of the exported file $ImportedFile='C:\Downloads\Crimes_-_2001_to_present.tsv' $db = (mongo @p "dbnew=db.getSiblingDB('Crimes')") $success=(mongo $db @p "db.createCollection('staging');")|ConvertFrom-JSON if ($success.ok -ne 0) {mongoimport --db Crimes --collection staging --type tsv --headerline --file $ImportedFile} else {write-warning $success.errmsg } |
If the import is working, you’ll see the status in the PowerShell window:
We’ll keep this string value for the database in for further examples, but you can simply substitute the literal string ‘Crimes’ if you prefer.
We can now examine a record
|
1 |
mongo $db @p 'db.staging.find({}).limit(1).pretty()’; |
Assuming that it all went well, we’ll see this.
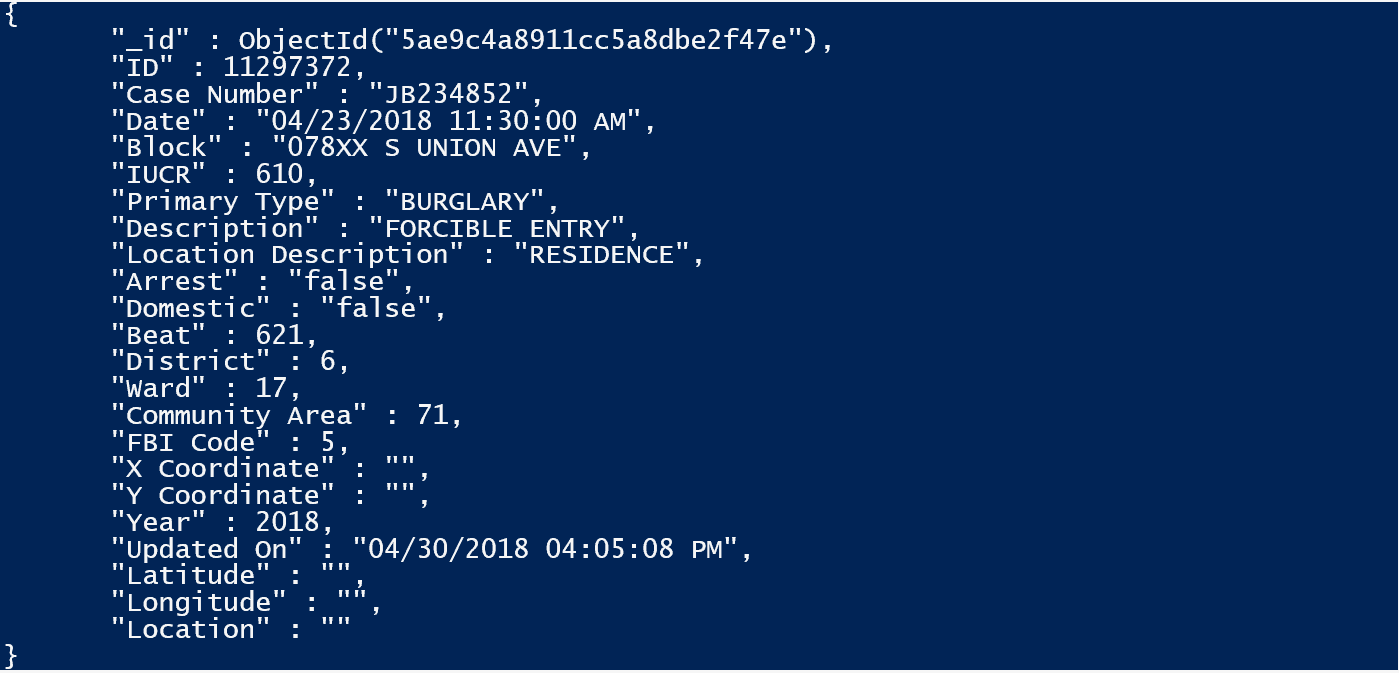
Beyond changing the two dates to an ISO form that is suitable for MongoDB, there is going to be very little preparation work that we will need to do , which is just as well if you are re-reading the database from its source regularly to keep it up-to-date.
This following command inserts a slightly modified form of the collection into the empty Crimes Collection of the Crimes database. We are using the ‘staging’ collection merely to make any data conversions or cleaning that we require. You can, of course, do the same thing by importing straight into the Crimes collection and updating the data. Those 1.0 values don’t represent the data, it tells the $project stage to include that item (zero if you don’t want it).
NOTE: In MongoDB, the term ‘aggregate’ is confusing for database people, because in an RDBMS aggregation will almost always result in a summary of the data. In MongoDB, any data transformation other than returning fields from a set of documents within a collection is an aggregation. The find() method is really just that (See my article How to Use the MongoDB find() Method).We can only do a limited range of projection options with the find() method so we’ll need an aggregation method.
|
1 2 3 4 5 6 7 8 9 10 11 12 13 14 15 16 17 18 19 20 21 22 23 24 25 26 27 28 29 30 31 32 33 34 35 36 37 38 39 40 41 42 43 44 45 |
$aggregate=@" db.Crimes.insert(db.staging.aggregate( [ { '`$project' : { '_id' : 1.0, 'ID' : 1.0, 'Case Number' : 1.0, 'Date' : { '`$dateFromString' : { 'dateString' : '`$Date' } }, 'Block' : 1.0, 'IUCR' : 1.0, 'Primary Type' : 1.0, 'Description' : 1.0, 'Location Description' : 1.0, 'Arrest' : 1.0, 'Domestic' : 1.0, 'Beat' : 1.0, 'District' : 1.0, 'Ward' : 1.0, 'Community Area' : 1.0, 'FBI Code' : 1.0, 'X Coordinate' : 1.0, 'Y Coordinate' : 1.0, 'Year' : 1.0, 'Updated On' : { '`$dateFromString' : { 'dateString' : '`$Updated On' } }, 'Latitude' : 1.0, 'Longitude' : 1.0, 'Location' : 1.0 } } ], { 'allowDiskUse' : false } ).toArray()); "@ mongo $db @p $aggregate |
There were 6526582 documents of 12 fields, taking 2.8 GB, Here is a typical database record. (using a slight modification of the previous find code – db.Crimes.find({}).limit(1).pretty();
|
1 2 3 4 5 6 7 8 9 10 11 12 13 14 15 16 17 18 19 20 21 22 23 24 25 |
{ "_id" : ObjectId("5a8f06e7318582208846f358"), "ID" : NumberLong(634), "Case Number" : "G000705 ", "Date" : ISODate("2001-01-01T10:40:00.000+0000"), "Block" : "024XX W MONROE ST", "IUCR" : "0110", "Primary Type" : "HOMICIDE", "Description" : "FIRST DEGREE MURDER", "Location_Description" : "CHA STAIRWELL", "Arrest" : false, "Domestic" : false, "Beat" : NumberInt(1125), "District" : NumberInt(11), "Ward" : NumberInt(2), "Community Area" : NumberInt(28), "FBI Code" : "01A", "X Coordinate" : NumberLong(1159921), "Y Coordinate" : NumberLong(1899604), "Year" : NumberInt(2001), "Updated On" : ISODate("2015-08-17T14:03:40.000+0000"), "Latitude" : 41.880224549, "Longitude" : -87.688248952, "Location" : "(41.880224549, -87.688248952)" } |
There are several interesting points here. Each crime is given an IUCR code (Illinois Uniform Crime Reporting code) which are four digit codes that law enforcement agencies in Illinois generally have adopted to use to classify criminal incidents when taking individual reports. Other states will have their own set of codes. The Chicago Police Department currently uses more than 350 IUCR codes to classify criminal offenses. It provides the meaning of each code as well in each document, but this, in database terms redundant. The Chicago version of these codes can be obtained from here: Chicago Police Department – Illinois Uniform Crime Reporting (IUCR) Codes:
There is an FBI code for ‘Index’ offenses that are collected by the FBI to document crime trends, and include major crimes such as murder, criminal sexual assault, robbery, aggravated assault & battery, burglary, theft, motor vehicle theft, and arson. The FBI Code tells you which, of 26 different categories (if any) the crime comes into.
To save you having to prepare this extra data, I have supplied it with the article. (See the Downloads section at the bottom of the article.)
You can read it in simply like this
|
1 2 |
mongoimport --db Crimes --collection iucr --type json --jsonArray --stopOnError --file S:\work\programs\Mongo\Crimes.iucr.json mongoimport --db Crimes --collection NIBRS --type json --jsonArray --stopOnError --file S:\work\programs\Mongo\Crimes.NIBRS.json |
These routines currently throw spurious errors that are not visible to PowerShell’s Try/Catch. Check the error values which are usually messages to say that the records were imported!
If you need to subsequently update data, you can use MongoImport to merge or ‘upsert’ into the existing data within MongoDB. You need MongoImport’s –mode option To do this, you’ll need to define an upsertField: this would be the original ID or maybe the Case Number in our data.
Tackling the Database.
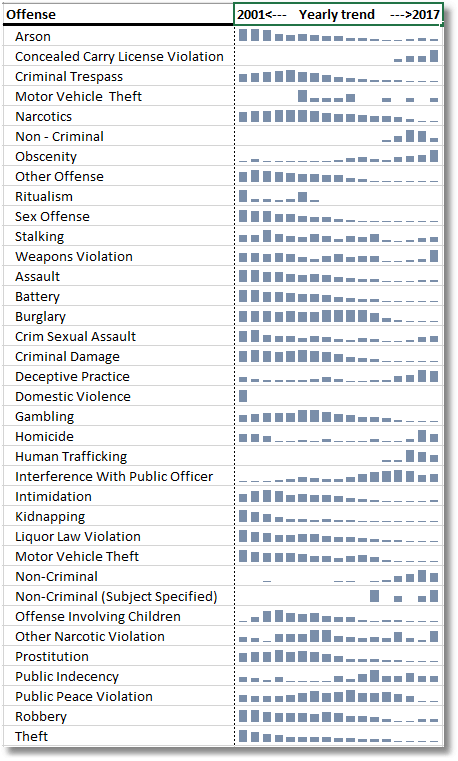
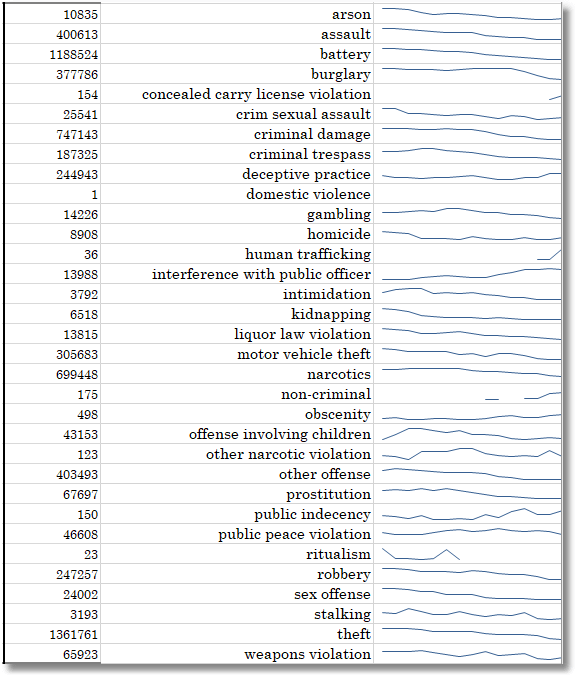
The Crimes database, at six and a half million records, is too big to go into a spreadsheet but fits happily in either a relational database or MongoDB on the laptop, so it is ideal for experimentation. We aim to get to the level of investigation shown below, in this case using Sparklines. To do this, we need to get the data into Excel.
To get the data to the point where we can do reporting on it within Excel, we need to reduce our working data within this database. We need to have an aggregation that just has the information that we need for our analysis. Once we have extracted just the essential information, then we’re ready to do the analysis on a dataset that is quick and easy to deal with. The objective is to reduce this data down to something that can be queried easily or exported into an application that allows you to slice and dice the data to explore trends.
In studying the data, we can reduce the detail down to a manageable size to create a collection that can be aggregated to provide data split a number of different ways. We don’t need all the crime descriptions on every record, and, if we can provide all the totals for each type of crime down to a week or month, then that is sufficient. We aren’t going to do any mapping for this exercise, so the location codes can go. We still have the full data, so we can extract another aggregation when it suits us.
The sort of queries we’ll want to perform are ones like this, which shows the sparklines for each type of crime between 2001 and 2018.
Driving the Machine
Before we can query the data in the Crimes collection, we will need to index it. Without an index in the imported collection beyond the default primary key, each query takes half a minute. If you try using lookups to information in other collections, such as the IUCR codes or FBI codes, the individual queries soon run into minutes. Here’s how to create a MongoDB index. We’ll index the CrimeID with a unique index.
|
1 2 3 4 5 6 7 8 9 |
mongo $db @p @' db.collection.createIndex({ ID: 1 //field to include }, { 'name' : 'CrimeID', 'unique' : true }) '@ |
This returns a json document that you can parse
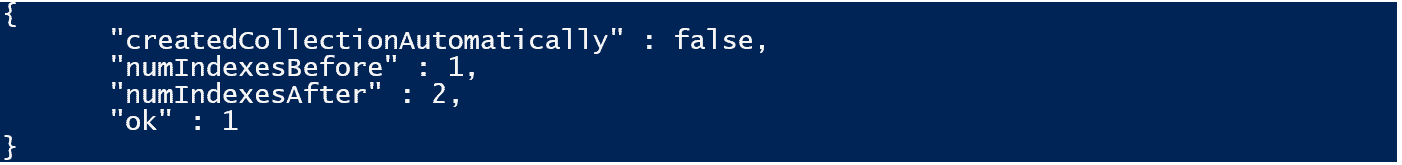
The type of additional index you’d want is based on the sort of querying you’d want to do. You can do covering indexes very effectively and they are a great performance booster.
Before we start using the collection methods for querying and aggregation, I must prepare you for a shock. We are using JavaScript. Whereas, in SQL, we are able to express the result that we want, in MongoDB, we have to explain how to get it, using JavaScript. Actually, MongoDB has a query optimiser and will decide the best indexes to use and so on. More recently, it has been able to change the order of pipeline operators to optimise the process and ensure that any filtering is done as early as possible in the process.
It is possible to create queries and statements in SQL and convert them to MongoDB JavaScript. There are third-party utilities that do this to a small extent but generally they fail to translate any but the simplest SQL code, or you can use a good ODBC driver which will allow you to use SQL to do selection and grouping. With the profiler that I explain here, you can then examine, modify, adapt and use the MongoDB code that you retrieve.
Creating Aggregated Collections
If we want to do effective reporting with a tool such as Excel, we will need the quantity of crimes of every category for every month, every weekday, and every year. We’re not, for the purposes of this demonstration, interested in doing it for every quarter. As well as the IUCR categories, we will want broader categories such as the FBI’s NIBRS categories
I have supplied both the iucr codes and the NIBRS codes and, if you’ve been following along, you will have loaded them. If you prefer, you can import the complete IUCR codes from the Chicago Police Department – Illinois Uniform Crime Reporting (IUCR) Codes: or alternatively just get the codes and their meanings from the Crimes collection.
So now we have three collections. Crimes, iucr and NIBRS.
Here is a typical document of the iucr collection that we can retrieve via this PowerShell statement
|
1 |
mongo $db @p "db.iucr.find( { 'IUCR' : '501H' }).pretty();” |
This will return this JSON document
|
1 2 3 4 5 6 7 8 9 |
{ "_id" : ObjectId("5a99936b3185822088aa8dd2"), "IUCR" : "501H", "NIBRS" : "26", "category" : "none", "details" : "hazardous materials violation ", "indexCode" : "N ", "offense" : "other offense" } |
You’ll notice that it maps the NIBRS or ‘FBI Code’ in the main collection. This, in turn, can link us to the information on the type of crime in the NIBRS associated with that. We can view this via this script.
|
1 |
mongo $db @p "db.NIBRS.find( { 'Code' : '26' });.pretty()" |
…which returns …
|
1 2 3 4 5 6 7 |
{ "_id" : ObjectId("5a902cb73185822088aa8bba"), "Name" : "MISC NON-INDEX OFFENSE ", "Code" : "26", "Type" : "CRIME AGAINST SOCIETY", "Definition" : "DEFINITION: THE VIOLATION OF MISCELLANEOUS LAWS OR ORDINANCES." } |
Before we present the full aggregation, we’ll go over the operations that we need to include in the final query
The first thing we’ll want to do is to extract from the full database just the lowest aggregation we are likely to need for our purposes. We’d want to do something like this.
|
1 2 3 4 5 6 7 8 9 10 11 12 13 14 15 16 17 18 19 |
$JSONresult= @' db.Crimes.aggregate([ // Stage 1 : Group by year, month and day of week { $group: { _id: { crime: '$IUCR', date_year: { $year: '$Date' }, date_month: { $month: '$Date' }, date_dayofweek: { $dayOfWeek: '$Date' } }, count: { $sum: 1 } } }, // Stage 2 : specify the output {$jason $project: { 'IUCR': '$_id.crime', 'Year': '$_id.date_year', 'Month': '$_id.date_month', 'Weekday': '$_id.date_dayofweek', 'count': 1, '_id': 0 } }], { allowDiskUse: true }).toArray(); '@ | foreach {mongo $db @p $_ } |
This will give the number of crimes committed for every date period in any month, broken down by the day of the week. (e.g. Monday, Tuesday etc).
We will also need to join to the IUCR table to get a description of each crime.
We can do this via a lookup (JOIN to you) which we can now add
|
1 2 3 4 5 6 7 8 9 10 11 12 13 14 15 16 17 18 19 20 21 22 23 24 25 26 27 28 29 30 31 32 33 34 35 36 37 38 39 40 41 42 43 44 |
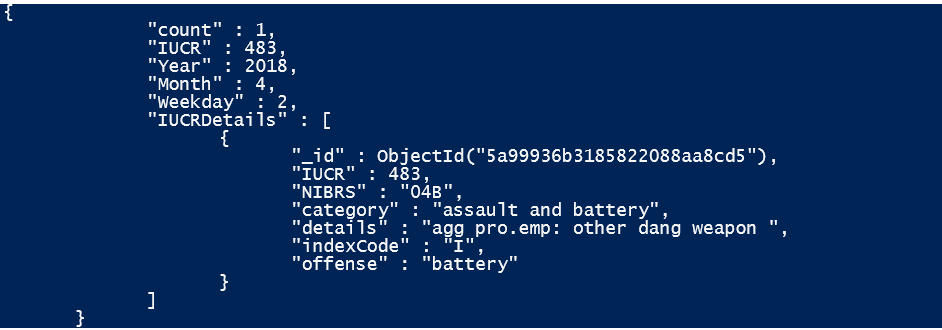
$JSONresult= @' db.Crimes.aggregate([ // Stage 1 : Group by year, month and day of week { $group: { _id: { crime: '$IUCR', date_year: { $year: '$Date' }, date_month: { $month: '$Date' }, date_dayofweek: { $dayOfWeek: '$Date' } }, count: { $sum: 1 } } }, // Stage 2 : specify the output { $project: { 'IUCR': '$_id.crime', 'Year': '$_id.date_year', 'Month': '$_id.date_month', 'Weekday': '$_id.date_dayofweek', 'count': 1, '_id': 0 } }, { // Stage 3 : join to the IUCR table $lookup: { from: 'iucr', localField: 'IUCR', foreignField: 'IUCR', as: 'IUCRDetails' } } ], { allowDiskUse: true }).toArray(); '@ | foreach {mongo $db @p $_ } |
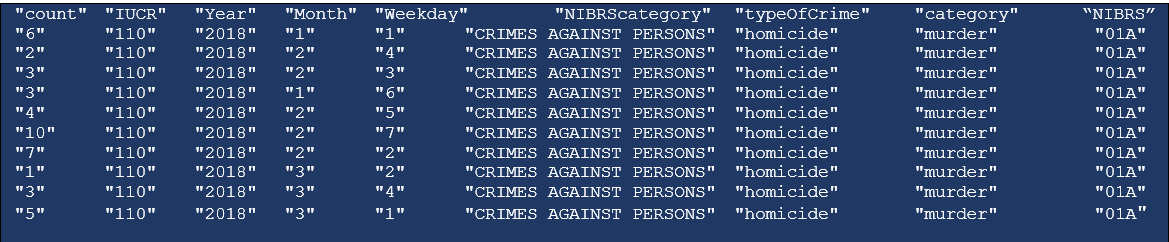
Which will give a collection of documents like this
And we also need to look up the FBI crime categories in the same way, so we can do crime figures split by their categories.
We do not actually want the output arrays in the final aggregation so we remove just the data we want and remove the rest.
We can now put all this altogether in a final aggregation that we can then use to slice and dice. This is similar to the SELECT … INTO statement, because it creates a new collection that then becomes the basis of all further aggregation.
We, of course, want to use an automated version so we can re-aggregate when we refresh the data
|
1 2 3 4 5 6 7 8 9 10 11 12 13 14 15 16 17 18 19 20 21 22 23 24 25 26 27 28 29 30 31 32 33 34 35 36 37 38 39 40 41 42 43 44 45 46 47 48 49 50 51 52 53 54 55 56 57 58 59 60 61 62 63 64 65 66 67 68 69 70 71 72 73 74 75 76 77 78 79 80 81 82 83 84 85 86 87 88 89 90 91 92 93 94 95 96 97 98 99 100 101 102 103 104 105 106 107 108 109 110 111 112 113 114 115 116 117 118 |
$aggregation=@' db.CrimeAggregation.insert(db.Crimes.aggregate( [ { // Group by year, month and day of week '$group' : { '_id' : { 'crime' : '$IUCR', 'date_year' : { '$year' : '$Date' }, 'date_month' : { '$month' : '$Date' }, 'date_dayofweek' : { '$dayOfWeek' : '$Date' } }, 'count' : { '$sum' : 1.0 } } }, { // specify the output from the grouping '$project' : { 'IUCR' : '$_id.crime', 'Year' : '$_id.date_year', 'Month' : '$_id.date_month', 'Weekday' : '$_id.date_dayofweek', 'count' : 1.0, '_id' : 0.0 } }, { //join to the iucr aggregation. Make sure both are numbers! '$lookup' : { 'from' : 'iucr', 'localField' : 'IUCR', 'foreignField' : 'IUCR', 'as' : 'IUCRDetails' } }, { //join to the NIBRS aggregation. Make sure both are numbers! '$lookup' : { 'from' : 'NIBRS', 'localField' : 'IUCRDetails.NIBRS', 'foreignField' : 'Code', 'as' : 'NIBRS' } }, { //flatten all the values we need from the subarrays '$project' : { 'NIBRScategory' : { '$reduce' : { 'input' : '$NIBRS.Type', 'initialValue' : '', 'in' : { '$concat' : [ '$$value', '$$this' ] } } }, 'typeOfCrime' : { '$reduce' : { 'input' : '$IUCRDetails.offense', 'initialValue' : '', 'in' : { '$concat' : [ '$$value', '$$this' ] } } }, 'category' : { '$reduce' : { 'input' : '$IUCRDetails.category', 'initialValue' : '', 'in' : { '$concat' : [ '$$value', '$$this' ] } } }, 'NIBRS' : { '$reduce' : { 'input' : '$IUCRDetails.NIBRS', 'initialValue' : '', 'in' : { '$concat' : [ '$$value', '$$this' ] } } }, 'count' : 1.0, 'Year' : 1.0, 'Month' : 1.0, 'Weekday' : 1.0, 'IUCR' : 1.0 } } ], { // set the collation for the new collection 'allowDiskUse' : true, 'collation' : { 'locale' : 'en_US', 'caseLevel' : true, 'caseFirst' : 'off', 'strength' : NumberInt(1) } } ).toArray()) '@ mongo $db @p $aggregation |
We now have the basic aggregation collection we need, and here is a sample document using the powerShell code
|
1 |
mongo $db @p "db.CrimeAggregation.find({}).limit(1).pretty();" |
… which returns this JSON document
|
1 2 3 4 5 6 7 8 9 10 11 12 |
{ "_id" : ObjectId("5ae9e6327ddc2daf6a5c0102"), "count" : 6.0, "IUCR" : 110.0, "Year" : 2018.0, "Month" : 1.0, "Weekday" : 1.0, "NIBRScategory" : "CRIMES AGAINST PERSONS", "typeOfCrime" : "homicide", "category" : "murder", "NIBRS" : "01A" } |
So now we have all the information we need for some pretty cool reporting. We now have a much more manageable collection with just 245,000 records and taking a mere 20Mb of space. This extract will be a lot more serviceable.
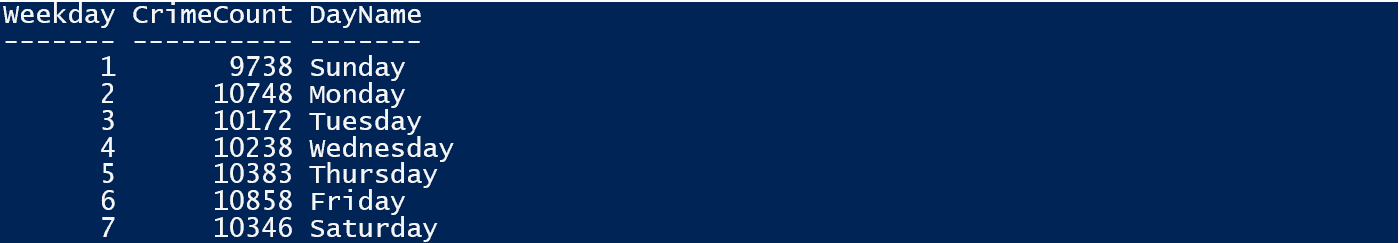
we can run all the obvious aggregate queries from it such as the number of crimes per weekday.
As you’d expect, there are more crimes on a Saturday, and fewer on a Monday, but it is only around ten percent difference. This query ran in half a second on a very slow laptop.
In PowerShell we would do this:
|
1 2 3 4 5 6 7 8 9 10 11 12 13 14 15 16 17 18 19 20 21 22 23 24 25 26 27 28 29 30 31 32 33 34 35 36 37 38 39 40 41 42 43 44 45 46 47 48 49 50 |
$aggregation=@' db.CrimeAggregation.aggregate( [ { '$group' : { '_id' : { 'Weekday' : '$Weekday' }, 'gp1' : { '$first' : '$Weekday' }, 'gp2' : { '$sum' : '$count' } } }, { '$sort' : { 'gp1' : 1.0 } }, { '$project' : { '_id': 0, 'Weekday': '$gp1', 'CrimeCount': '$gp2', 'DayName': { $switch: { branches: [{ case: {$eq: ['$gp1', 1]}, then: 'Sunday'},{ case: {$eq: ['$gp1', 2]}, then: 'Monday'}, { case: {$eq: ['$gp1', 3]}, then: 'Tuesday'}, { case: {$eq: ['$gp1', 4]}, then: 'Wednesday'},{ case: {$eq: ['$gp1', 5]}, then: 'Thursday'}, { case: {$eq: ['$gp1', 6]}, then: 'Friday'}, { case: {$eq: ['$gp1', 7]}, then: 'Saturday'} ], default: 'Neverday' } } } } ], { 'allowDiskUse' : false } ).toArray(); //you always need to do this to return data to Powershell '@ (mongo $db @p $aggregation)|convertfrom-json |
Notice that we must use single quotes and pass the results back as an array to allow PowerShell to convert it into a PowerShell object
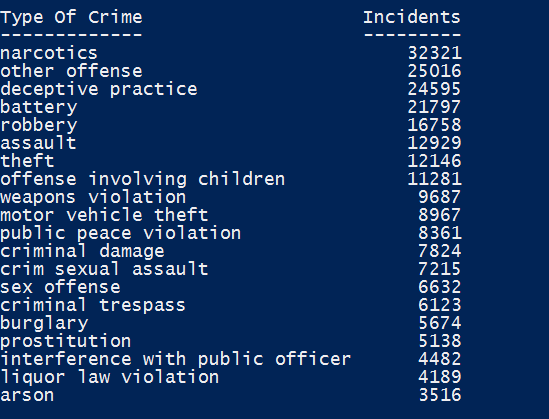
We can also see which are the commonest crimes
|
1 2 3 4 5 6 7 8 9 10 11 12 13 14 15 16 17 18 19 20 21 22 23 24 25 26 27 28 29 30 31 32 33 34 |
mongo $db @p @' db.CrimeAggregation.aggregate( [ { '$group' : { '_id' : { 'typeOfCrime' : '$typeOfCrime' }, 'COUNT(*)' : { '$sum' : NumberInt(1) } } }, { '$project' : { '_id' : NumberInt(0), 'Type Of Crime' : '$_id.typeOfCrime', 'Incidents' : '$COUNT(*)' } }, { '$sort' : { 'Incidents' : -1.0 } }, { '$limit' : 20.0 } ], { 'allowDiskUse' : false } ); '@|Convertfrom-json| format-table |
Moving on to Reporting
We are getting to the point where we can do more exploration using an appropriate tool such as Excel, so we export it to a CSV format that excel can read in. MongoExport.exe throws an unspecified category of error in PowerShell even if it works successfully, hence the awkward code. It works fine in the command shell but fails in PowerShell.
|
1 2 3 4 5 6 7 8 9 10 11 |
$mongoDirectory = 'C:\Program Files\MongoDB\Server\3.6\bin' $MongoExportPath = "$mongoDirectory\mongoexport.exe" $MongoExportFile = 'C:\Downloads\Crimeaggregation.csv' try { & <strong>cmd.exe</strong> /c "`"$MongoExportPath`" /db:Crimes /collection:CrimeAggregation /fields:count,IUCR,Year,Month,Weekday,NIBRScategory,typeOfCrime,category,NIBRS /type:csv --out $MongoExportFile" } catch { if ($_.Exception -like '*error*') { throw $_.Exception } } |
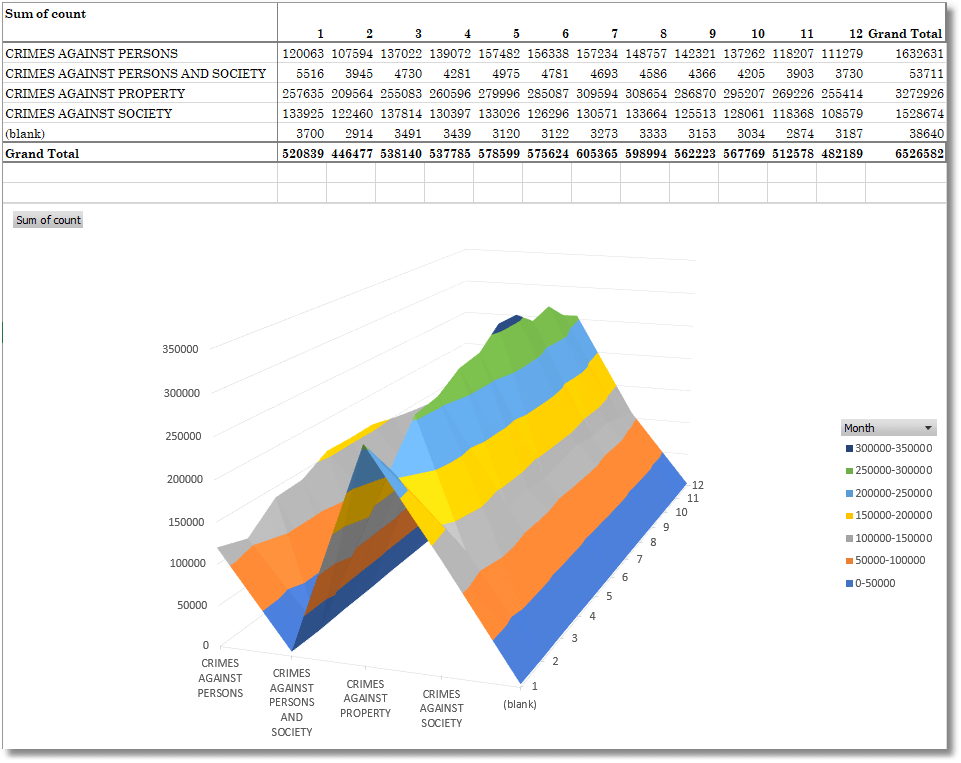
We can now import this from within Excel and do a pivot table. This gives you a good summary over the years …
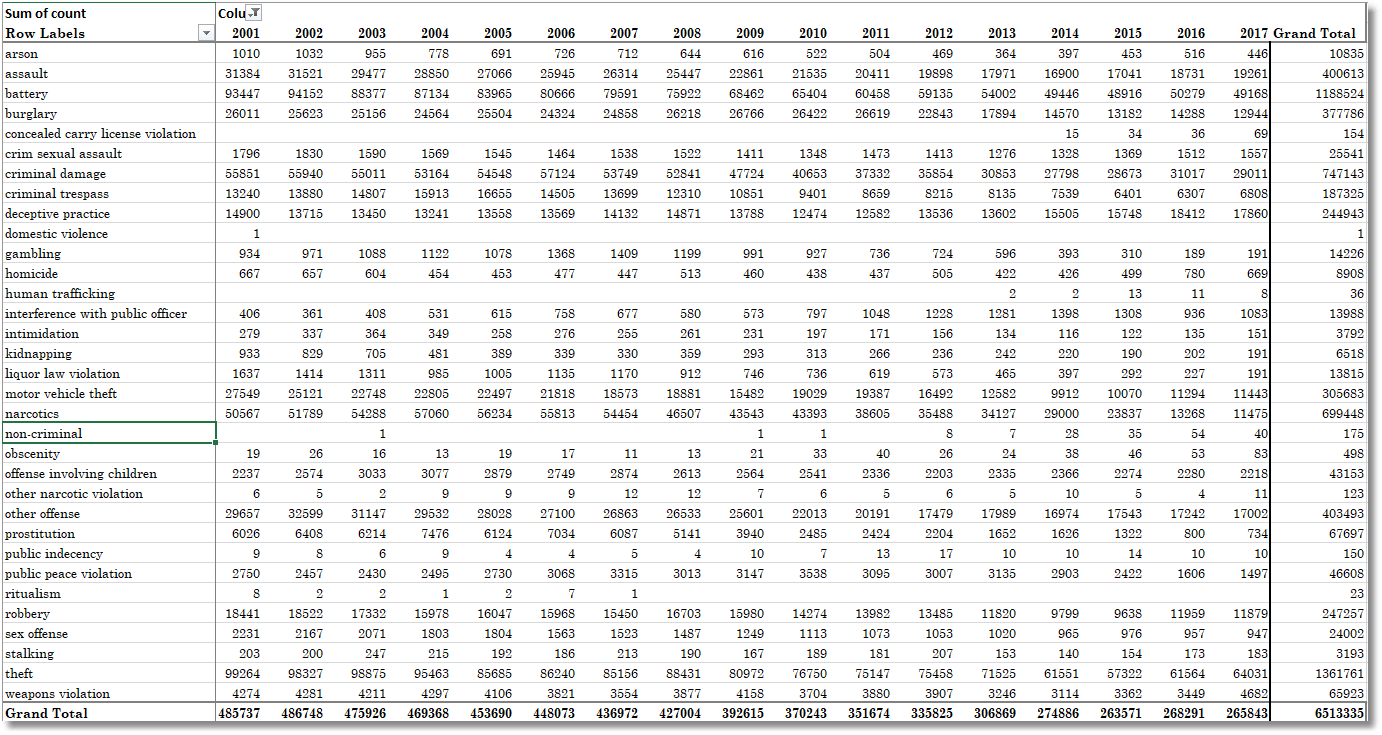
… from which we can draw sparklines
We can also see how the crime level varies according to the time of the year, and a surface map tells us that February is a quiet time for all sorts of crime, both against persons and property, whereas July and August are the most difficult months.
Conclusions
So we’ve done a quick walkthrough of using PowerShell with MongoDB all the way through from getting the raw data from the internet, reading it into MongoDB, and creating an extract of the full collection that allows us to do whatever ad-hoc aggregations we want. It is now so small in size that we can read it into Excel and produce graphs and charts to drill into the data and provide reports. At the up-front cost of around two minutes to reduce the full data down to our summary, we now have opened the road to quick exploration.
By using PowerShell with MongoDB together, we’ve effectively delivered the cleaned and aggregated data to the final destination, whether it be for reporting or a feed for a relational database. It is a combination with a great deal of potential.
References
- Studio 3T – The GUI for MongoDB
- Chocolatey – The package manager for Windows
- Install MongoDB Community Edition on Windows — MongoDB Manual
- Setting Up a MongoDB Service Under Windows via PowerShell
- Glossary — MongoDB Manual
- MongoDB Basics for .NET by Example – Simple Talk
- Crimes – 2001 to present | City of Chicago | Data Portal
- How to Use the MongoDB find() Method and Indexes to Find Data Quickly | Studio 3T
- Chicago Police Department – Illinois Uniform Crime Reporting (IUCR) Codes | City of Chicago |
- db.collection.createIndex() — MongoDB Manual
- How to Investigate MongoDB Query Performance | Studio 3T
- A Practical Introduction to MongoDB Views
- How to Prepare Data Before Creating a MongoDB Collection
- How to Develop an Effective MongoDB Indexing Strategy
- MongoDB, A Database with Porpoise
Load comments