The series so far:
- The BI Journey: The Analyst
- The BI Journey: The Expert’s Advice – Part 1
- The BI Journey: The Expert’s Advice – Part 2
- The BI Journey: The Journey Begins
Ruthie, the intern at the AdventureWorks sales department was in her final stages of building a semantic model for data analysis. She had had a busy week and weekend where she had initiated a business intelligence solution that evolved out of a lunchtime conversation (The BI Journey: The Analyst). She had not wasted much time since that conversation; she had read-up, gotten herself a dataset, built a prototype, and had shared it with her boss for feedback. Once she got feedback, she found herself a mentor, George, who was an expert in the field. She spent the weekend meeting with him, getting advice and incorporating the advice along with her boss’s feedback into the solution she had built. She was planning on presenting the solution to Stephen the following Monday (The BI Journey: The Expert’s Advice – Part 1). It was now Sunday, and she was adding the finishing touches to her dimensional model. She would then add the semantic layer on top, and then, to complete the solution, build a report.
The Date Table
When Ruthie’s dimensional model was in its basic form, George had asked her to add a table for dates. Date (or Calendar) is a special dimension table that is required in almost all analytic data models. It is also special since, unlike other dimensions, Date (or Time in certain cases) does not have a source. Of course, the transaction tables such as orders do have dates in them, but if you were to pull out these dates into a Date table you would most probably end up with a list of dates with gaps in them, explained George. That was because some transactions naturally do not happen on certain days such as holidays. But to do data analysis using dates it is important that a continuous list of dates be available. If not, actions such as comparing facts against a point in time in a prior year or viewing the trend of sales across the year may result in anomalies.
Ruthie first created a Date table from the Data tab of Power BI desktop. This is where, George said, most of the semantic modeling will be done from. Since the Date table didn’t have a source it had to be generated using DAX functions. George encouraged Ruthie to use the DAX reference online to help her along and suggested creating the table herself without help.
Working from the Modeling tab, she inserted a table. Using the CALENDAR and DATE functions, Ruthie first generated the rows for the table with a column holding a list of dates:
|
1 |
Date = CALENDAR(DATE(2017, 01, 01), DATE(2018, 12, 31)) |
She then derived more columns for day, week, month, quarter and year from the date column.
|
1 2 3 4 5 |
Day = FORMAT([Date], "DDD") Week = "Week " & WEEKNUM([Date],2) Month = FORMAT([Date],"MMM") Quarter = "Q" & FORMAT([Date], "Q") Year = YEAR([Date]) |
She created more derivatives of month; one with the year and month concatenated as follows:
|
1 |
Month Name = YEAR([Date]) & " " & FORMAT([Date],"MMM") |
She then created one that was made up of month numbers, so that she could use the column to sort the Month and Month Name columns. Otherwise, the months would list in alphabetical order instead of chronological:
|
1 |
Month Number = (YEAR([Date]) * 100) + MONTH([Date]) |
The entire table including the columns, Ruthie wrote in DAX, and she thought it was pretty cool. She was liking each aspect of creating a business intelligence solution and could not wait to create the report she had in mind.
The Star (and Snowflake) Schema
Once the Date table was setup, Ruthie linked it with the orders fact table to complete the star schema. Now that the orders star schema was completed, she needed to figure out a way to connect the Date table to targets, which was another star schema. However, the date portion of the targets’ granularity was month. So, Ruthie now quite familiar with dimensional modeling techniques promptly split the Date table at the month and created a Month table, linking both using a new column called Month Code.
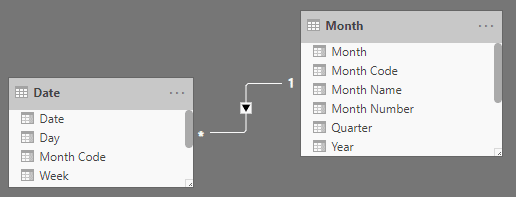
Figure 1: Date and Month tables
The dimensional model, a combination of two star schemas, was now done. The product table was also split at the product category because sales targets were only budgeted at the product category level.
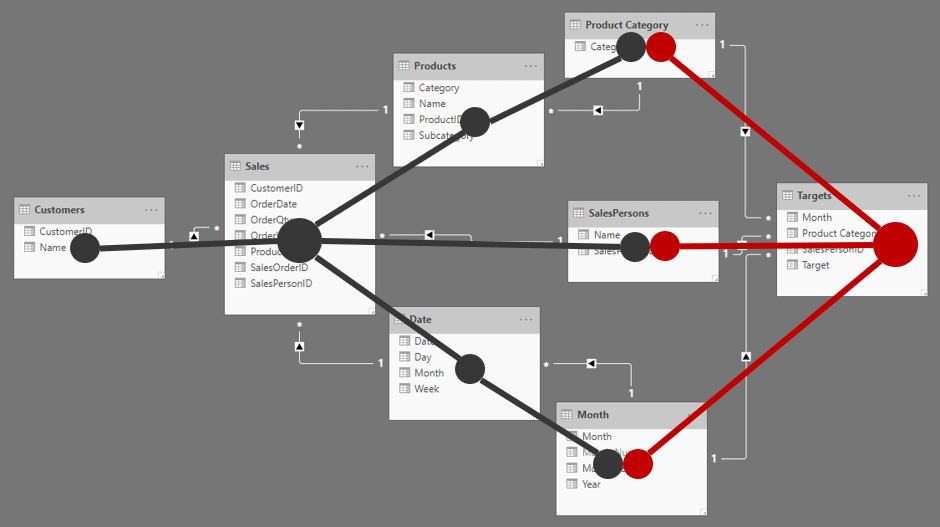
Figure 2: Dimensional model
Completing the Semantic Layer
The semantic layer is what interfaces with the end user (or the business user who builds reports). Therefore, George had explained, it had to be designed as business-centric and user-friendly as possible. One had to go into the most detailed aspect to achieve this; even to the level of ensuring that a metric has thousand separators, so that a user is not confused if a number is a million or ten million by just glancing at it. George handed a list of some best practices and advice that should go into the semantic model. She also had the list of requirements and changes that Stephen had given her after he had looked at the first iteration of the solution. Most of what Stephen gave her needed to be created at the report level, nevertheless, she wanted to include whatever from that list that made sense in the semantic model.
Ruthie put down a quick, condensed checklist of both lists, so that she could see if there were dependencies and ambiguities between the lists and to quickly tick off the items as she completed them:
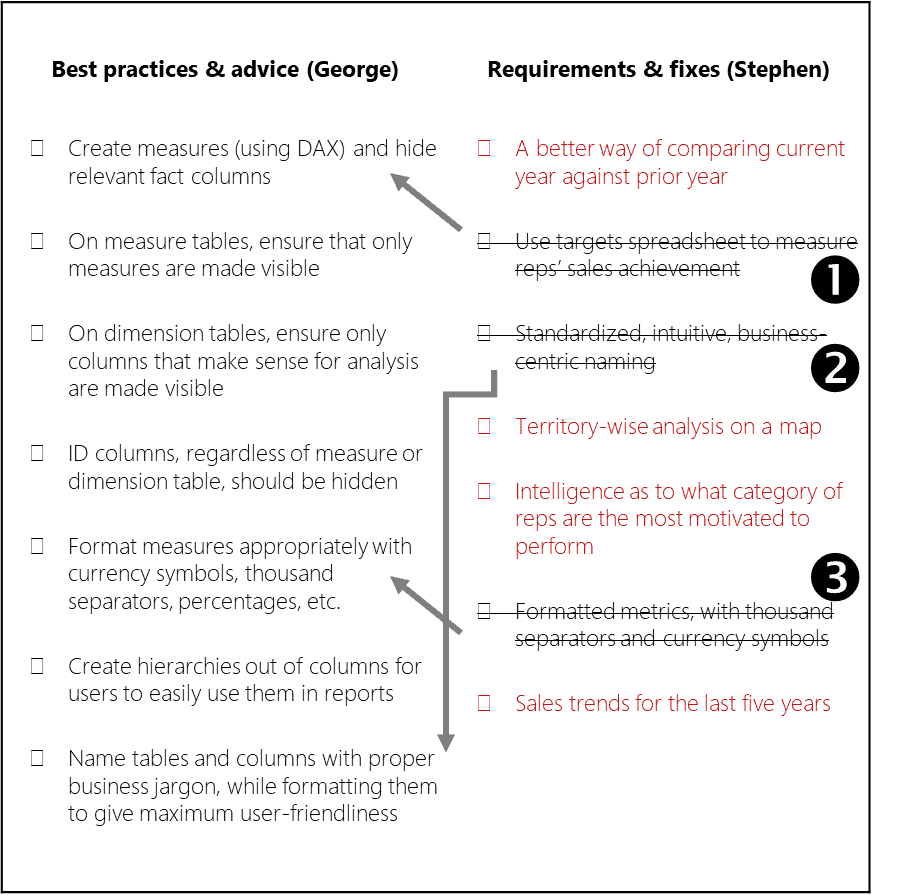
Figure 3: Checklist of best practices, requirements and fixes
Ruthie struck out ambiguous items, marked dependencies, and highlighted report requirements in red (so that those can be looked at later). She struck out the following from Stephen’s list:
Item – The targets spreadsheet was already absorbed into the data model, and the achievement measure created.
Items – These were already items in George’s list.
Measures
Ruthie proceeded to create measures on top of the dimensional model. The following were already created (The BI Journey: The Expert’s Advice – Part 1):
- Revenue
- Units
- Target Units
- Achievement %
- Order Count
She started thinking about more measures that could be added to the semantic model; what more will business users want to see? She immediately remembered one of the items from Stephen’s list: A better way of comparing the current year’s sales with that of the prior year. Right now, in the preliminary version Ruthie had given him, Stephen had to switch between the years in the slicer back and forth (which was utterly pointless) or rely on a trend visual to see the difference between the years, which was only useful to an extent.
Time Intelligence
She soon figured out that she needed a Revenue Growth measure which would show the difference in revenue between the selected (or current) year and the year prior as a percentage. She was quite glad about her idea because she noticed, while doing some research, that it was a standard measure used in the industry.
To create this measure, she had to first create another measure; the prior year’s Revenue (PY Revenue).
|
1 |
PY Revenue = CALCULATE([Revenue], SAMEPERIODLASTYEAR('Date'[Date])) |
She then used PY Revenue to calculate Revenue Growth:
|
1 2 |
Revenue Growth % = CALCULATE(DIVIDE(([Revenue] - [PY Revenue]), [PY Revenue], 0)) |
She quickly tested it out, and it looked good:
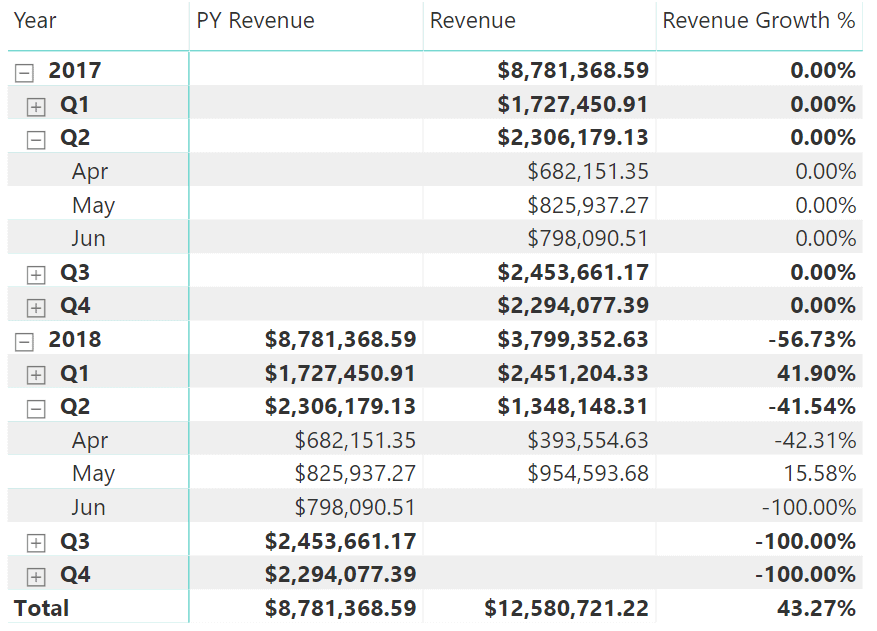
Figure 4: PY Revenue and Revenue Growth test
Ruthie learnt that these measures, which were created using various date-based fields as filters, were called time intelligence measures and were a common occurrence in business intelligence solutions.
Measures, such as MTD Revenue (month-to-date), YTD Revenue (year-to-date), PY YTD Revenue, YTD Revenue Growth %, and more, which were derived off base measures such as Revenue, provided business users with the ability to perform various types of analysis with ease. This helped users focus on their analyses, and not waste time trying to figure out the logic for calculations each time a measure had to be “modified” for a particular type of analysis. For example, If the user wanted to view a graphic of rolling revenue values from the beginning of the month on a daily basis, the Revenue measure cannot be just used on the visual since it would only show each day’s revenue instead of a rolling number. Which means the user would have to come up with a way to create a calculation that would do this. So, instead of letting the user do all that, if the data model already provided it, it would only be a matter of using that measure: a productivity win.
All of this required that the date (or calendar) table is marked as a Date table in Power BI. Doing this ensured that the date table had an unbroken sequence of dates, a prerequisite for time intelligence.
Formatting the Semantic Model
A good portion of George’s checklist dealt with formatting the semantic model. This shouldn’t be too hard, thought Ruthie and got things completed in fifteen minutes.
Once all the measures were created, she hid all the base aggregation columns:
In addition, she ensured that all the ID columns that were used to link to the dimension tables were hidden, and also their counterparts in the dimension tables. ID columns were only useful for linking tables, and hardly had any analytical value:
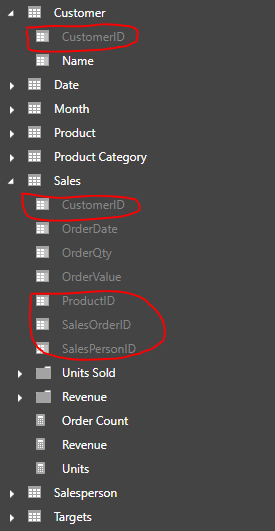
Figure 5: Hidden ID columns
Then she looked for any other columns that did not make sense as part of a dimension so that she could hide them too. However, she only found the Month Number column in the Month table.
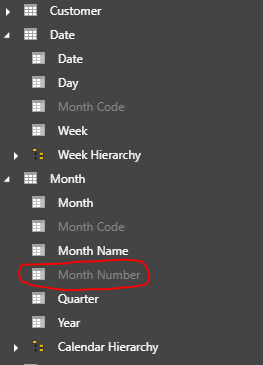
Figure 6:Hiding columns not needed for analysis
Finally, she formatted all the measures appropriately with currency formatting, percentage formatting, thousand separators, and decimal places, and made sure the tables and columns were named properly (dimensions in singular form and facts in plural form).
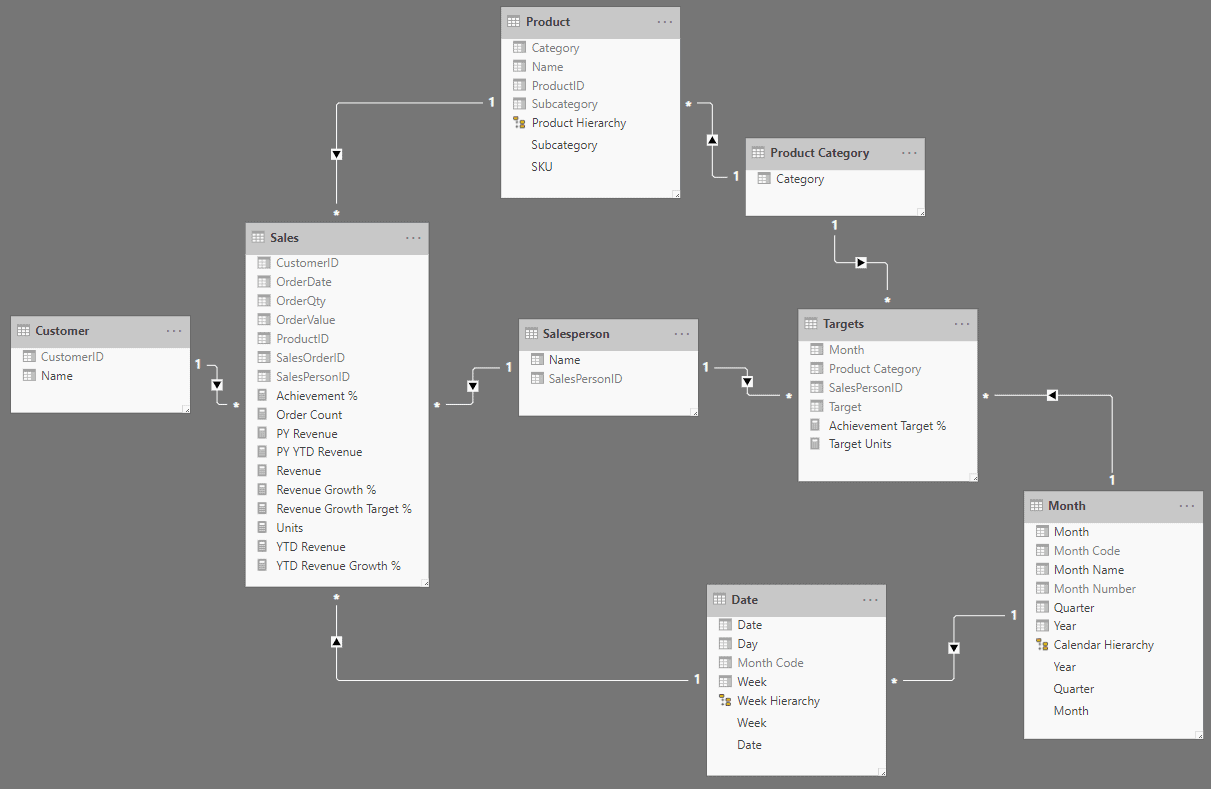
Figure 7: The semantic model in the relationships view
When she gave the semantic model a final look, she saw a model that gave the business users a business-centric, user-friendly set of tables that were intuitive to use. Measures were separated into their own tables so that they could be easily identified, while at the same time the measures were grouped into folders so that they could be easily located. Aptly-named, formatted measures self-described how they could be analyzed.
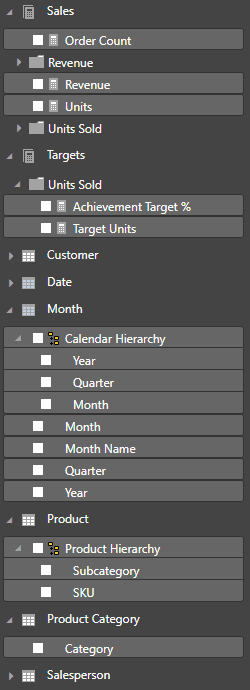
Figure 8: The semantic model in the report view
Dimensions had their own tables with only the columns that are used for analysis, while also being arranged into hierarchies so that it saved confusion such as “would Brand come under Category, or would Category come under Brand?”.
User Requirements
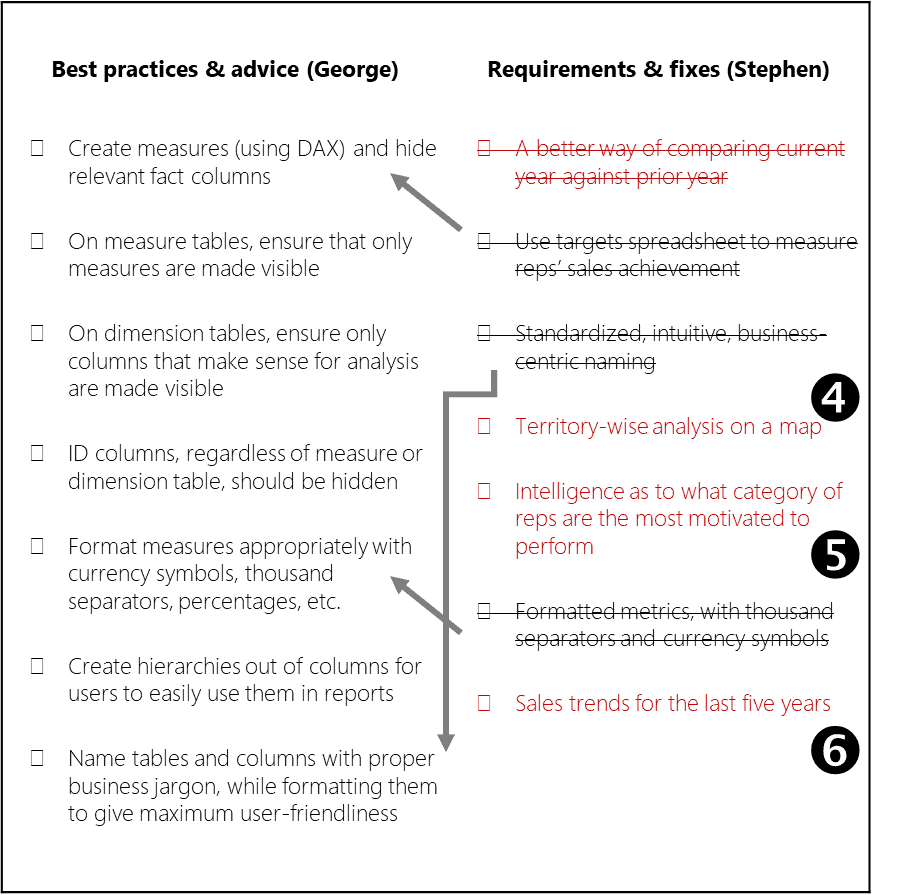
Figure 9: Checklist of best practices, requirements and fixes
She now turned to the items left over in red. She now realized that and required more data to be pulled in. required that sales territory information be brought in, which would necessitate the creation of a new dimension. required that three more years’ worth of records are pulled into the sales fact table on top of the two years of data that Ruthie already had.
Now this is a fix, thought Ruthie. She had not anticipated that she would have to put in more effort in the querying department. She had not much time left of the weekend, and she had to complete the report. But at the same time, she wanted to really impress Stephen by incorporating all his requirements.
Then she looked at the final item and her heart sank. suggested a type of analysis that Stephen wanted where he would know what which category of salesperson was the most productive, and this category that Stephen was talking about could be anything: a certain age bucket, a certain experience level, a certain salary range, anything!
Backlogging
Ruthie was worried now, she did not want all her hard work to be worthless when Monday came. She called George for guidance. George assured her that whatever she had done so far was quite a lot, and that there were always situations when the tasks that needed to be completed required more effort than what was anticipated.
George explained the importance of maintaining a backlog of tasks with an estimate of effort and priority. This way, when there was limited time to complete all the work, one could decide as to which tasks will be done during that time, based on priority and effort, and leave the rest of the tasks for another time. This way expectations can be set with the stakeholders as to what they could expect to see this time, and what they could expect next time. He told her that there was more to that concept, but for now not to worry about it, and that she could defer items and for later and include item which would only require her to get the 5-year set of data of the same dataset she had.
Ruthie, feeling better now, thought it was a good idea and suggested that she would ask Dan, the DBA for the five-year sales dataset as soon as she went in to office the next day. She could quickly do a file replace and get Power BI to refresh the data set.
Reports
Ruthie was now finally at the point of creating reports. She decided to provide a summary page, and a detailed page which had the detailed analysis of what was on the summary page.
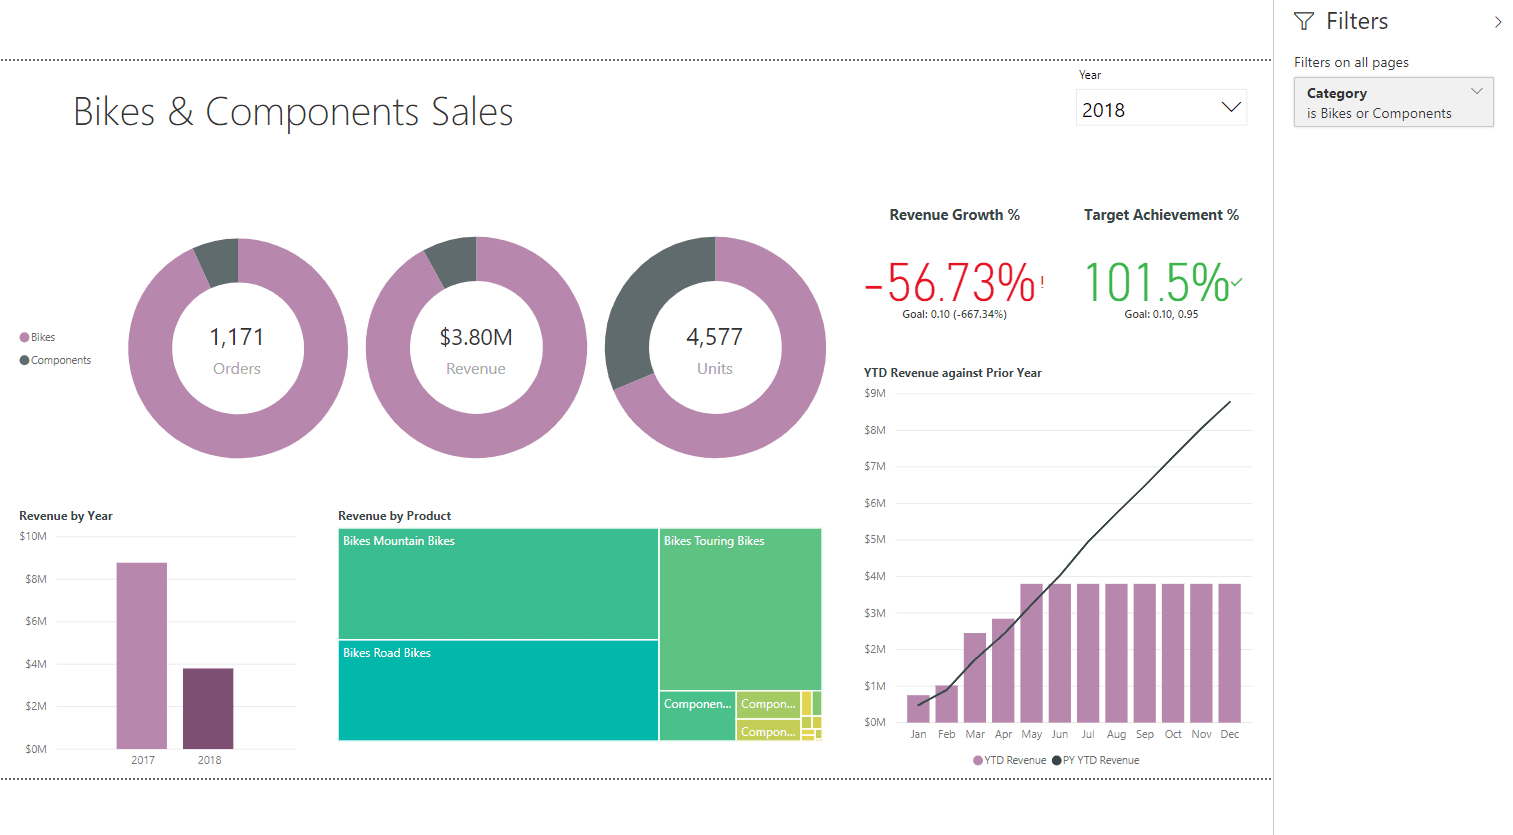
Figure 10: Summary Page
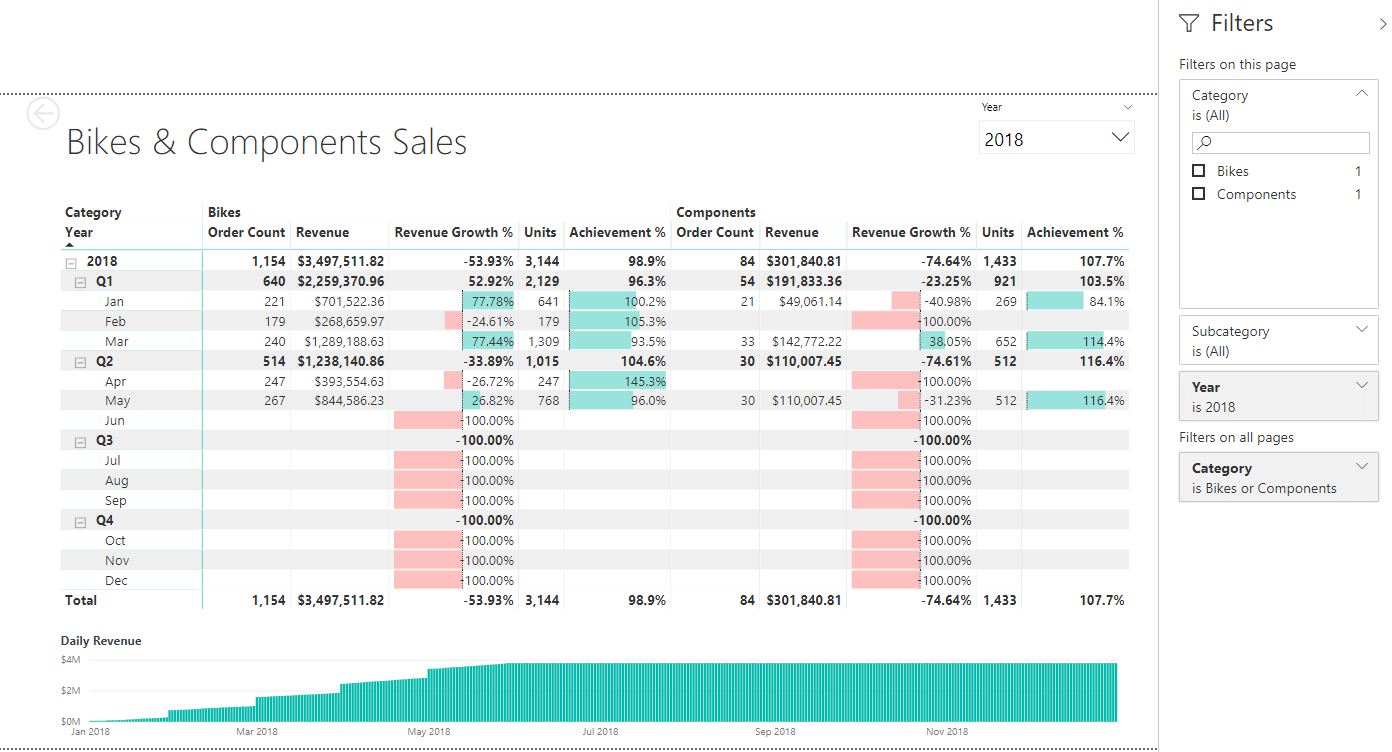
Figure 11: Detailed Page
Ready for Launch
Ruthie’s sense of satisfaction was double from what she felt the previous night. She was quite confident and proud of her solution, despite not completing the list of requirements. She had them in a backlog, and would work on them during the next week, after the solution was showcased.
The solution she had built comprised of a semantic data model which was cleansed and formulated to be user-friendly and intuitive for business users, with all possible measure made available. The model was made up of data that came from two sources; the sales database, and the sales targets spreadsheet. On top of the semantic model was a visual analytic report that represented the data as an overview, and then allowing for it to be drilled down and through for detailed analysis. The best part of the solution was that it allowed the business users to quickly create their own reports by making use of the data model and then sharing and collaborating with other users.
Ruthie’s joyful realization at the end of all this was that she now understood that a BI solution was not a one-time thing. It needed to evolve, it should evolve, and it will evolve, as users’ requirements kept increasing, as they keep seeing more and more value from the solution. She was ready and looking forward to all of it.
Load comments