Self-service business intelligence is everywhere these days. It helps organizations or departments get started with business intelligence quickly. All they need is a data dump in an Excel file, and a tool that would create magic out of it. And there you have it… a business intelligence solution! While calling a couple of reports built off an Excel a solution may seem like overkill, there is truth to that. Business analysts, who work for different departments within an organization need to quickly put data together from one or more systems, build a data model on top of that, and perform analysis to get an understanding of what is going on in their departments. When they present their findings to the stakeholders, and when the stakeholders see value in it, it is indeed a solution to a problem.
Power BI has evolved over the years and months into a tool that can do wonders with your data. Many an insightful report and dashboard complete with beautiful layouts have been built, and those who use its insights to make informed decisions have seen value in the solutions.
The issue, however, occurs when many such overzealous solutions start cluttering the environment that it becomes quite hard to maintain. Moreover, you would not know if all these solutions indeed possessed the single version of the truth. How one set of users define a metric, or a KPI differs from how others define them. When these two sets of users come together at a quarterly sales summit and start presenting their insights, everything but fisticuffs break loose. It becomes evident that when self-service business intelligence starts hitting the brinks of madness, a method needs to be put into place to contain it.
The traditional approach of going through the process of gathering and consolidating extensive requirements, then building the near-perfect data warehouse did keep the madness at bay: A single source of truth that served as the basis for the organization’s analytic and business intelligence needs. However, it was frustrating to stakeholders when development dragged on, and users’ needs changed. Technical folk quite rarely understood the business acumen needed to provide the information the way business users needed it. Organizations usually spent a lot of money on business intelligence initiatives and had to wait quite a while before enjoying its benefits. That is exactly why self-service business intelligence came into the picture in the first place and quickly evolved.
The two prior paragraphs describe a chicken and egg situation. Here’s the middle ground: You need an approach where you look at business intelligence as a journey. You start small with self-service business intelligence, continually improving until you get to a point where it can be ported to a data warehouse. The premise is to see value quickly and then tweak it; it is business fronted, not IT fronted. IT takes over when it’s time to go to the data warehouse.
However, when it comes to a small organization, or a single department, where budgets are tight, and the luxury of having technical folk around is scarce, you need to somehow set up camp with these limitations.
The Beginnings
The Scenario:
The sales department of a retailer, AdventureWorks, is using Power BI for their day-to-day business intelligence needs. They have a business analyst, Ruthie, who develops data models and reports and makes it available for the head of sales and other sales personnel. The new ask is that the head of sales and the sales personnel will be able to do their own analysis and reporting. The goal is to reduce the madness and streamline analytics. The first report that was built for the sales department was the Bike and Component Sales report.
Note: You can read about the background story and business case here: The BI Journey: The Journey Begins.
Traditionally a business analyst starts performing self-service BI by obtaining an Excel file with the desired data and manipulating it by applying formulae, creating pivot tables and graphs, and building their own Excel-based reports (and dashboards).
With Power BI being the tool of choice, the business analyst obtains data as before in Excel and probably other files in other formats. In this example, dumps of master data such as that of customers, geographical locations of dealers, and products in Excel, and a dump of transactions for the past the years in a comma-separated value (CSV) file are available. The analyst keeps these files on her hard disk and uses Power BI Desktop to import data from these files, mashes them up and comes up with a model with sales metrics, along with related dimensions.
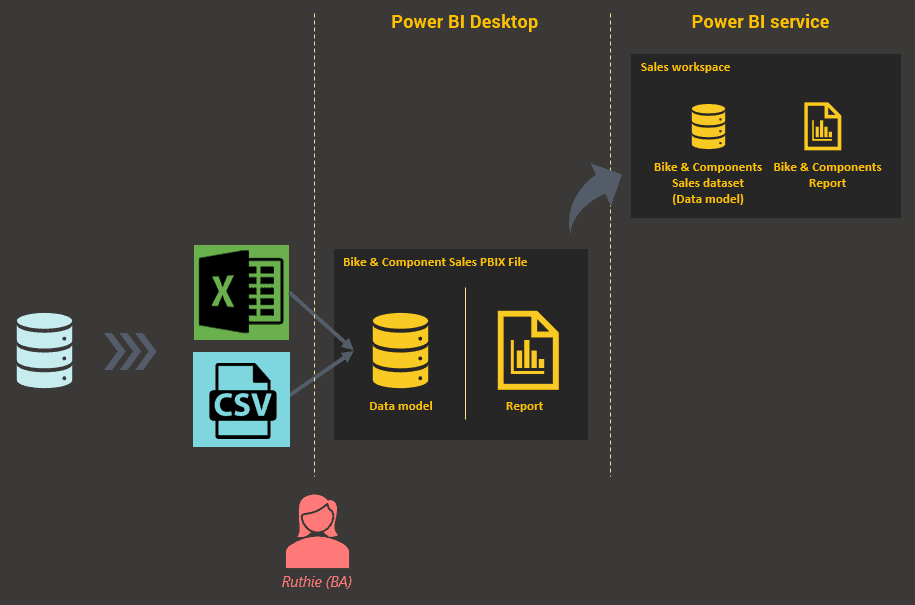
Figure 1: Getting Started
She then creates a report on top of this model with a summary page and a detail page. Once done, she publishes the report to the Power BI service. Every dataset (which is what a data model is called after being published to the service) and report needs to belong in a workspace, and in this case, the dataset and report are published to the Sales workspace.
Clutter
Since a business analyst (or for that matter any user) perceives a Power BI report as a combination of a prepped dataset and a layer of visual elements applied on top, they typically don’t see the bigger picture. When more use cases for reporting come up, more reports are created using the method described above, resulting in a lot of clutter.
In addition to the Bike and Component Sales report, requests have now come in for Overall Sales and Sales Compared to Sales Targets.
As depicted in Figure 2, when the business analyst builds reports for each of these requirements, each time building a new model behind the report, the clutter in the Sales & Marketing workspace becomes evident.
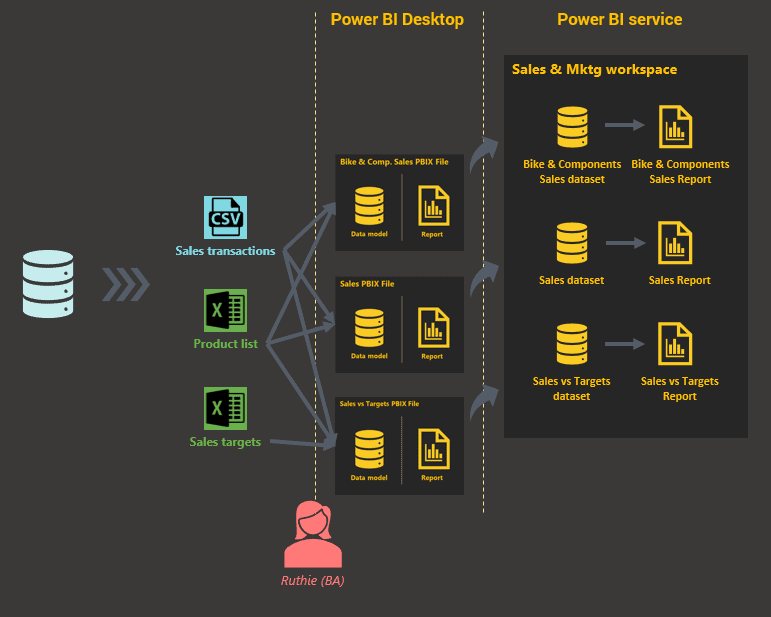
Figure 2: Typical usage
Taking a closer look at the reports in the workspace and the datasets that the reports are based on, it is plain to see that they all revolve around sales. One has sales with targets included, one has sales of only particular categories, while the third has overall sales.
Standardization
Standards, in the form of a reusable, extensible dataset, allows reducing clutter and creating a single source of truth, so that all reports share the same dataset. This also increases manageability and saves a lot of development time. This shall be called the master dataset, and as all datasets do, the master dataset originates in a PBIX file in Power BI Desktop.
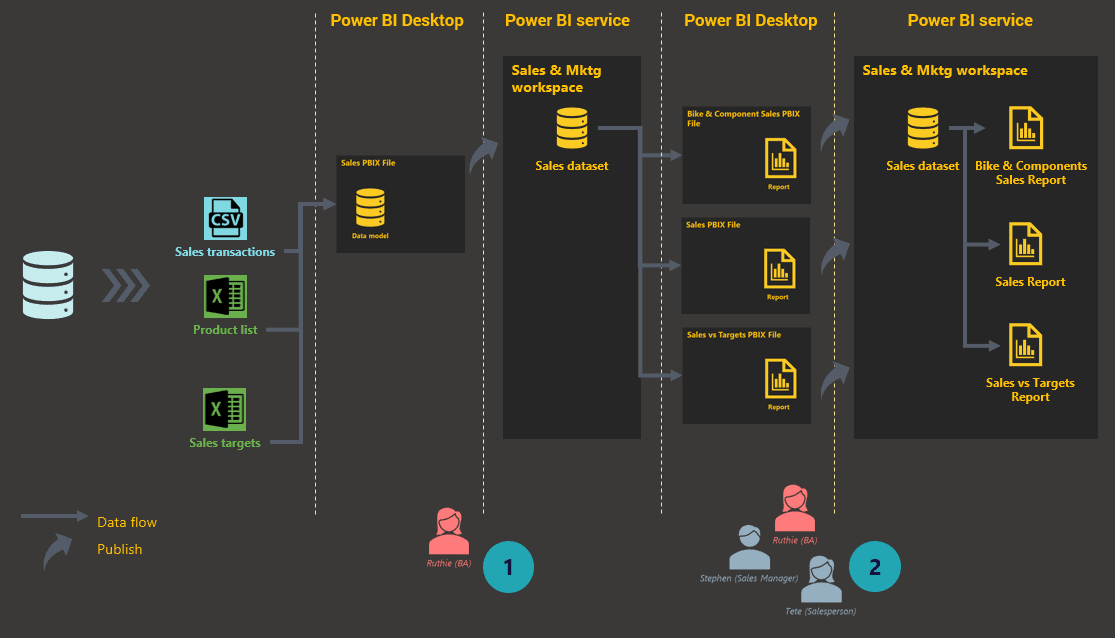
Figure 3: Getting started with an efficient process
As accomplished in Figure 3, requirements of all the (sales) reports have been consolidated into a single master sales data model by the business analyst. This is then published to the Sales & Marketing workspace.
The current reports are then recreated by using the published master dataset as their source. The reports can be built in the browser directly or, even better, by using Power BI Desktop. Reports created using Power BI Desktop will then be published to the Sales & Marketing workspace.
Handling further complexity
From here on, each time a new reporting requirement comes in, the business analyst would look for the possibility of building the report from the master dataset. If not possible, then include the requirements into it by modifying the Sales PBIX file accordingly and publishing it to the workspace.
The head of sales now wants the solution extended to the marketing folk in the department as well.
As more requirements such as marketing reports come in, despite Power BI being able to include these requirements into the existing master dataset, the ideal approach will be to build a separate marketing master dataset. This dataset will then be the source for all marketing reports and will be hosted in the Sales & Marketing workspace.
As the number of business areas or departments that need business intelligence increase and start requesting their own sets of reports, new workspaces will be needed to house the datasets and reports needed by these groups of users. The above approach extends to satisfy this need, resulting in an architecture that looks like what’s depicted in Figure 4.
Each master dataset will focus on a specific business area, such as sales, marketing, or finance. All of the datasets in this example would definitely contain sales data, but since the way they are used and analysed are different from each other, their internal structures have a good chance of being completely different.
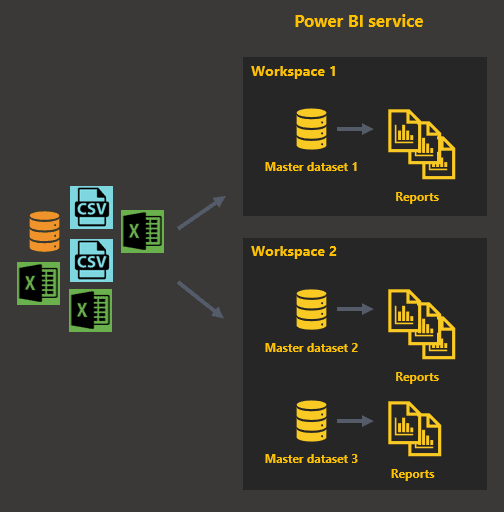
Figure 4: First architectural iteration
Architecture
While the above architecture works well when reporting requirements of the business areas and departments are different from each other, often you would see a requirement where a master dataset is needed in another workspace. Say that when the finance department runs their monthly status meetings, their dashboard requires that sales metrics are shown alongside finance metrics. This clearly gives rise for the sales master dataset to be made available to the finance department, which runs their analytics off their own workspace.
While the need is clear for a global master dataset, datasets that can be shared across workspaces in Power BI is not a thing, at least not yet. Hence, a master dataset is global only within a single workspace.
However, there is hope in the form of a workaround. Since a master dataset originates as a data model in a Power BI Desktop file, by hosting the file on OneDrive for Business or SharePoint, you could easily make it a global master dataset.
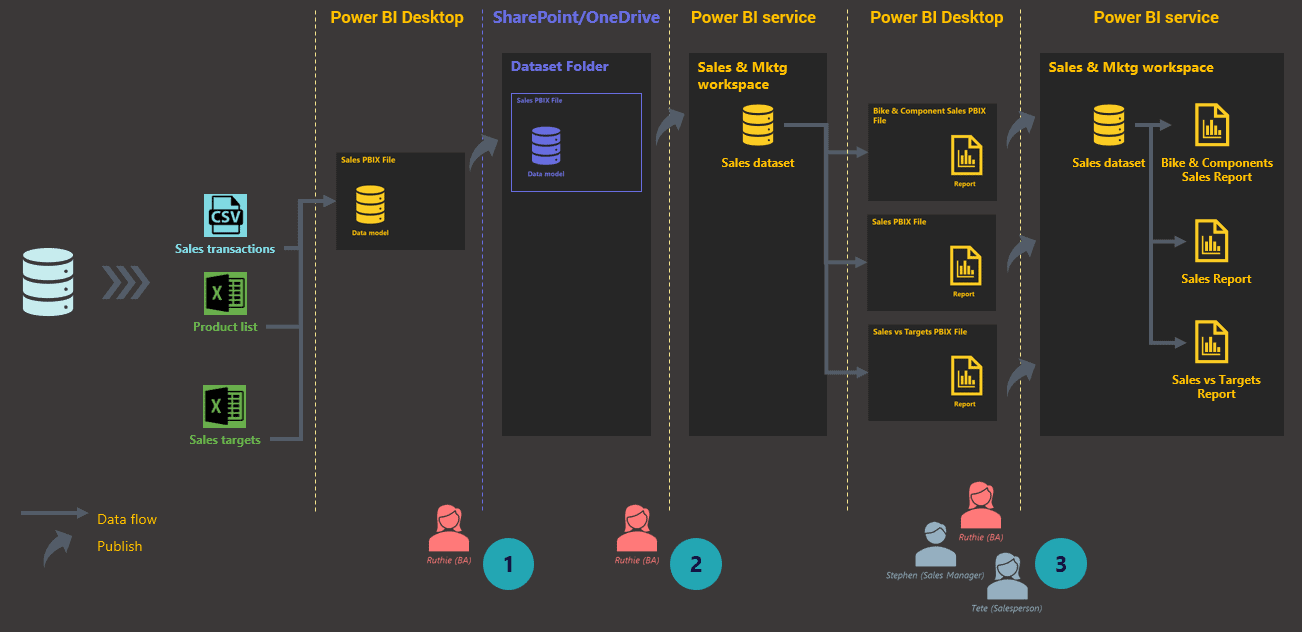
Figure 5: Setting up global master datasets
The business analyst now, instead of publishing the PBIX file to the Power BI service, uploads the file to a SharePoint or OneDrive for Business folder. This folder will be the designated master dataset repository. When a master dataset is needed in a workspace, the business analyst can simply import it into the workspace and start using it. The final architecture based on the new process will look like this:
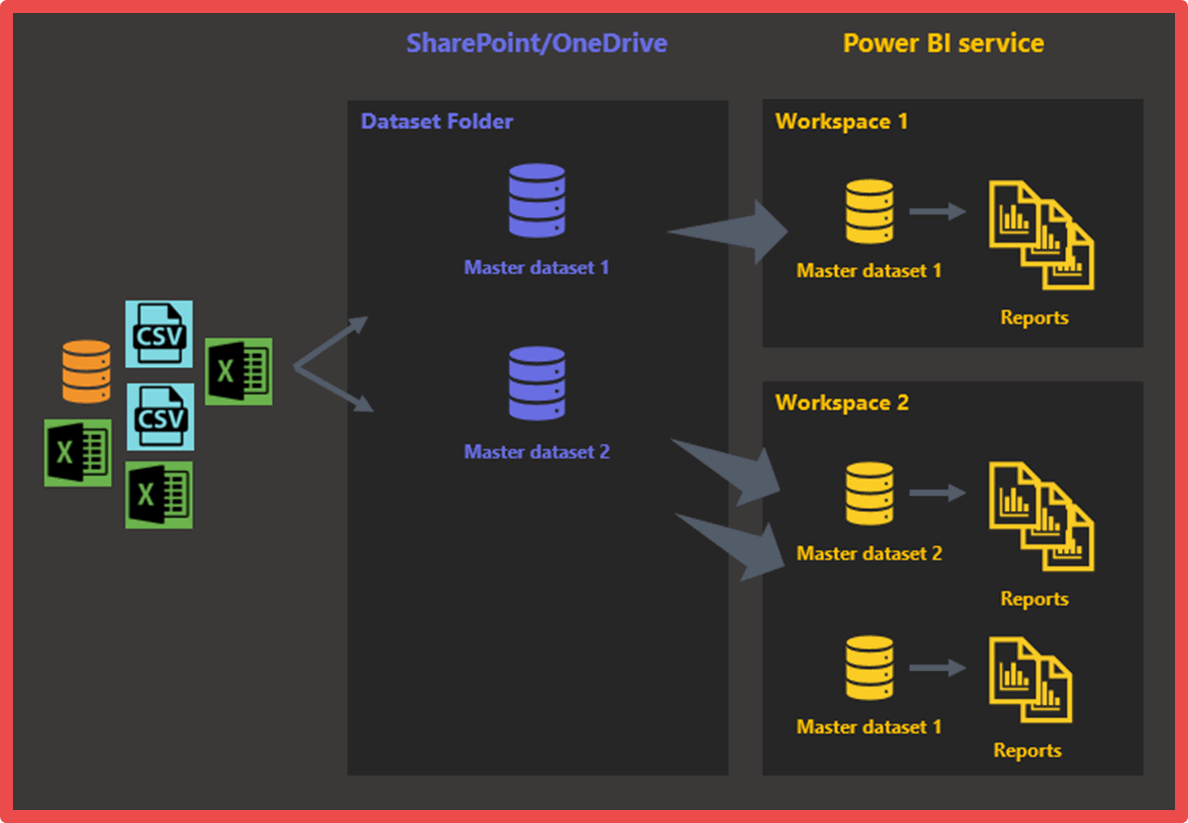
Figure 6: Second architectural iteration
Source Control
Another important aspect that needs to be considered, especially in the case of a master dataset, is source code control. Source code, or in this case, the master dataset’s evolution needs to be tracked. The evolution of the dataset progresses each time the dataset is modified and published to cater to new requirements. This involves the history of the file: who performed the changes and when. This way, if any reports break due to changes, you can easily reinstate an older or previous version. Also, if the logic of calculating a metric was mistakenly altered, the last known working version can be retrieved, the correct logic pulled out, and then applied on the new version.
Keeping track of the master dataset history can be performed using a variety of tools that provide various features. However, within Power BI’s immediate ecosystem, the obvious choice is SharePoint or OneDrive for Business. Hence, if your choice for the master dataset repository was SharePoint, then there is nothing more that needs to be done when uploading a new PBIX file, but a small change in the process. OneDrive for Business, too, has this functionality but based on organisational settings the option may be unavailable.
SharePoint and OneDrive for Business automatically keep track of file history as files are saved or uploaded. What needs to be done additionally is:
Check out the file from SharePoint or OneDrive for Business. This would ensure that no one else makes changes on that file until you complete your changes and return the file to SharePoint or OneDrive for Business. 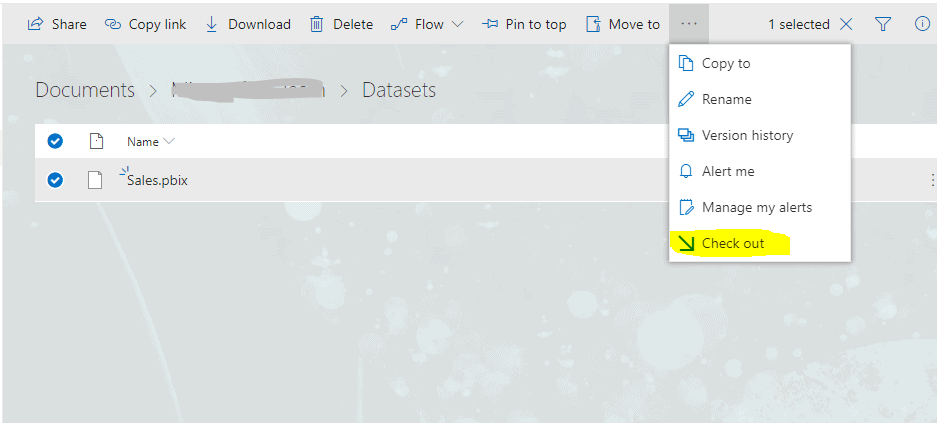
Figure 7: Checking out a PBIX file
Once the changes are complete, upload the file to SharePoint or OneDrive for Business, and check in the file with a comment describing the changes that were made.
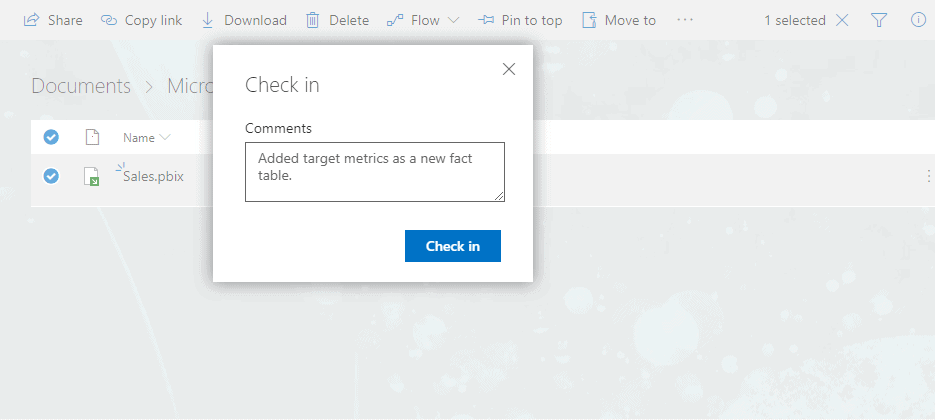
Figure 8: Checking in a PBIX file
Testing Ground
Another good idea, especially when the number of data model authors (mainly business analysts) and report authors (business analysts and end users) increase, is to form a “testing ground” environment. The testing ground will be the first point of deployment for datasets and reports, before being deployed to “production”.
Conclusion
The final architecture is a result of an iterative process, through trial and error. Since Power BI is positioned primarily as a business user’s tool, and marketed as a tool that can transform cloud and on-premises data into stunning visuals in one single view scaled across the organization with built-in governance and security, it becomes easy to forget that a proper process or structure needs to be put into place for the tool to be used efficiently. After everything that is said and done, Power BI is only a tool; it is not a solution. The solution needs to be provided through the tool and requires a structure and process surrounding it.
In most cases, a structure and process are considered only when issues and inefficiency raise their heads. Putting in a process after a solution has commenced operations involves considerable work, due to re-work and mindset change. Hence, applying architecture and process for a business intelligence solution, such as what is described in this article from the onset gives the users an easier and streamlined means of adopting the tool.
Load comments