As DBAs, our bosses often assume blithely that, among all the urgent tasks and car crashes of our daily DBA existence, we find time somewhere to remain “current” on most database and data-related technologies, or really anything with the word “SQL” somewhere in its name. At any given point, they expect us to be able to converse intelligently on SSRS, SSIS, SSAS as well as BI analytics, big data, and so on.
Back in January, I described my brief foray, as a DBA, into the world of BI analytics, marrying my reports with various elements of the Microsoft BI “stack” to produce interactive PowerView reports in PowerPoint. The results were mixed and aside from adding yet another technology to my “must learn” list (Data Quality Services), the main upshot is that I now only pretend to be a BI professional on the weekend.
Still, the BI bug didn’t leave me. I still browse the BI-related online documentation, keep my test environments up to date, and what I’d learned left me eager to find out more about a whole raft of BI-related technologies, and especially the new features of Excel 2013.
In particular, I became intrigued by the possibility of using an SSRS report directly as a data source for Excel. As new Excel features go, it’s one of the more obscure, I will admit, and yet its potential seemed to jump out at me. The life of an SSRS report begins with a request, like any other development effort. This request is then passed to a designer or developer who may create tables, views, stored procedures, ETL processes, and ultimately a report that is distributed either in an ad-hoc or scheduled output to the requestor. In short, it’s a substantial development effort. If we need another incarnation of the report in Excel, surely it’s a lot of unnecessary duplication to access the underlying tables or code and develop it from scratch. Why not just use and adapt the developed report with its data feed and parameters? If I were a report developer, I could see that it is now possible to, in a single application, tie into the hard work and creativity of others and take full credit. OK, that is a stretch and unfair, but the possibilities seem clear.
SSRS Reports as Data Feeds
Open Microsoft Excel 2013. I am going to assume that you have Excel 2013 and all of its various data add-ins. Everyone seems to have it these days, because it is the porthole into which you will view most of the new BI tools and services in “The Stack”. Open a workbook and navigate to the PowerPivot tab and click on Manage on the Data Model tab. This will bring up the PowerPivot for Excel workbook. Click on Get External Data, and you will see that we can retrieve data from a database, including SQL Server and MS Access (my old standby), or from Data Service, or from “Other Sources”, which is the one we need. Scroll down to the Data Feeds section and you should find the Report option.
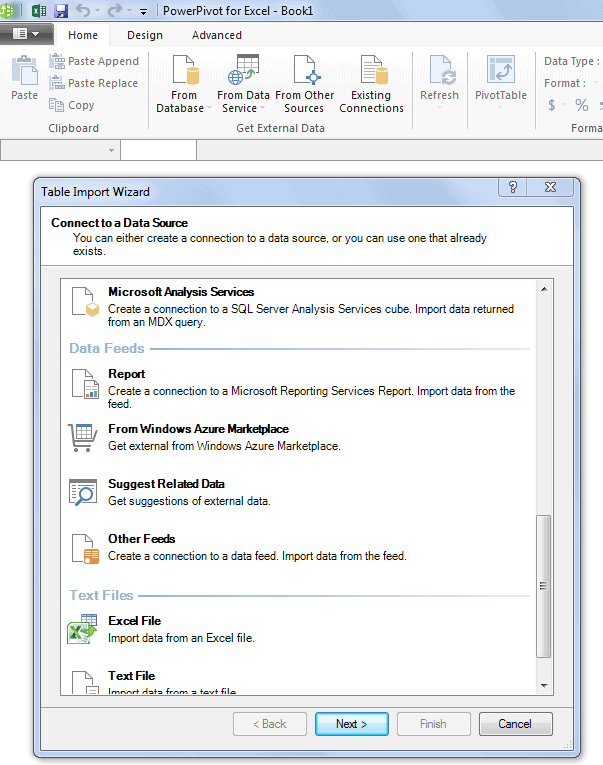
Figure 1 – Data from Other Sources in PowerPivot
Of course this is not a new idea. Data feeds like this use Open Data Protocol or OData to access data via a standard format, in the case of SSRS, XML-based Atom. You can learn more about OData, Atom and JSON here:
SSRS Disk Space Report as Excel Data Feed
So let’s see how this idea of pulling data from a feed like SSRS translates to a pragmatic alternative data source in Excel. In this example, I’ve used one of my existing SSRS reports, one with few parameters that the DBA team uses to monitor the drive space on their SQL Servers, although almost any report will do (ones with row-based detail, or summarized reports, work well).
Simply enter the URL of the ReportServer Web service, which was on my local system in my case, at http://localhost:8080/ReportServer, and we’re presented with a list of folders on the report server.
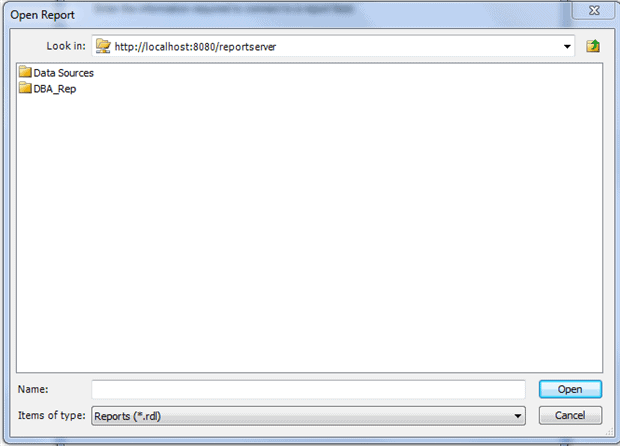
Figure 2 – Opening a Report from the ReportServer instance.
In the DBA_Rep folder, I have the report called SQL Drive Space that contains a summary of used and available disk space on each drive for each SQL Server. It also calculates at what percent capacity is each drive, based on the size of the entire volume and the total size of all of the databases. Open the report, and it will load into the Table Import Wizard. In Figure 3, you can see that the “I” drive on server 0LCRPQSK is 89% full.
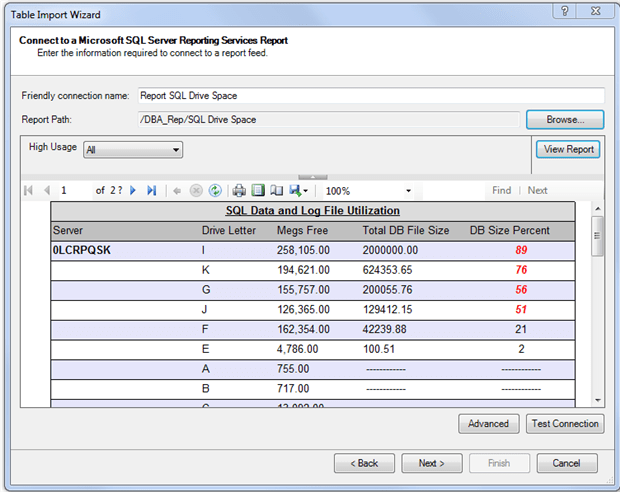
Figure 3 – SQL Drive Space Report Used as a Data Source in Excel
The report has one parameter, High Usage, which is nothing more than a filter that when applied displays high usage on only those disks that are above a certain capacity threshold, in my case above 30% (at the time I created this report I was one paranoid DBA). Notice also that the high usage cases appear in scary red.
The main reason I am noting the parameter is because I want to understand how the report will function as a data source, depending on the parameter value. Will the report correctly display more or less data based on the value? How will refresh options work? Will I be able to see the report parameters when I refresh? What happens when I add a calculated column to the model? These are all fair questions and there is only one way to finds the answers, and that’s to try it out.
Choose High Usage instead of All as the parameter value and click Next, before I think of any more questions. On the next screen, we have the option to give the table a Friendly Name; I chose Amity, since it’s a very friendly name but also it reminds me of a certain shark who will eat all of my disk space. There is also a Preview and Filter button that presents a grid of data and the ability to check or uncheck individual columns that you may r may not want to include in the data model. I am going to go with the default, which is to select all of the columns.
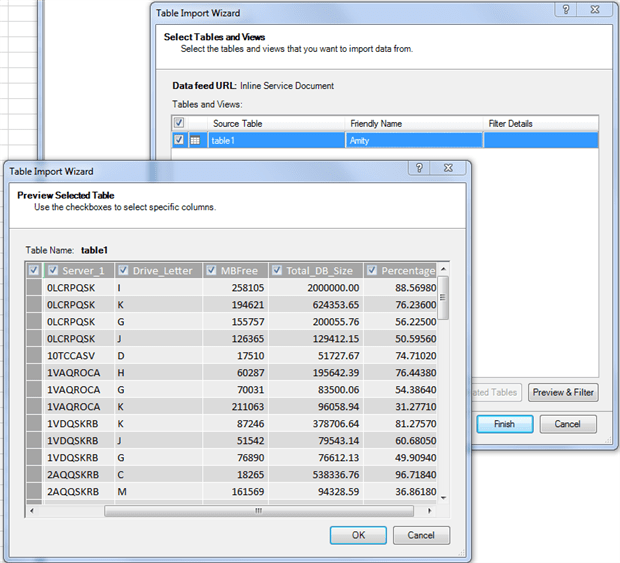
Figure 4 – Previewing the SSRS Data.
After clicking OK on the preview window and then clicking the Finish button, I can see that I imported 364 rows into the new table called Amity, as shown in Figure 5. Now I can set about answering some of those nagging questions.
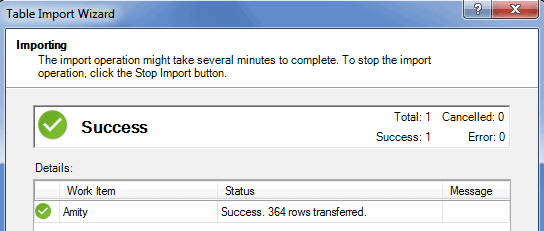
Figure 5 – Successful Import of Rows
The first question regarding a refresh is an easy one to answer. The import and the parameter selection is a onetime process and the parameter choices are stored with the data model. Clicking the Refresh button will not bring up the report to allow me to choose other parameters. However, it is possible to Edit an Existing Connection to change the parameter values and overwrite the existing model data with new data, filtered by other parameters.
Let’s edit the exiting connection “Report SQL Drive Space” and choose ALL instead of High Usage for the parameter, as shown in Figure 6.
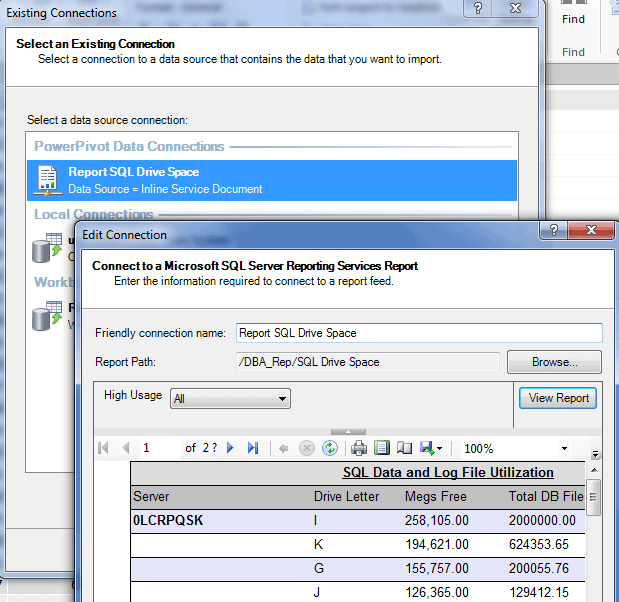
Figure 6 – Editing the Existing Connection for the Data Model
So, it is possible to use a single report to modify the data model within Excel by editing the existing connection. It is a manual process, for sure, and users would need to be trained on how to perform this task. But it is an important point to make as I could see Excel power users wanting the ability to pull in filtered data from the source as opposed to pulling in all of the data and then filtering it locally in Excel.
At this point we are still working exclusively on the data model, though we certainly could pop open a pivot table or pivot chart and prepare a report for publication, perhaps to SharePoint, or even to send to another user.
Adding a new column to the Data Model
Before we do that, though, let’s add a simple calculated column called Total Capacity, which will simply sum the Megs Free and Total DB Size columns.
All we need to do it put this formula, =[Total_DB_Size]+[MBFree], in a cell in Add Column. To make it even simpler, you can click the column headers and they will be placed automatically in the formula, instead of having to type. So for the simple formula above all you would really need to type in would be an “=” and “+”. As a DBA and not an Excel Master, this was a leap forward in my thinking. Please don’t share that revelation with anyone. When done, the model looks like Figure 7.
My main focus for this article was to show how to use an SSRS data source so I won’t go deeper into the BI Semantic Model (BISM) or Data Analysis Expressions (DAX), which could be used to further develop the data model. You can learn more about DAX here: http://office.microsoft.com/en-us/excel-help/data-analysis-expressions-dax-in-powerpivot-HA102836919.aspx.
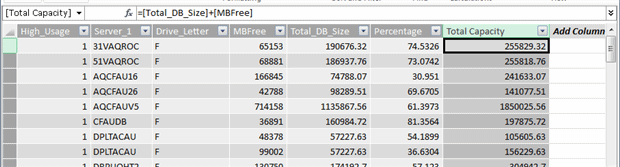
Figure 7 – Adding a Column
PowerPivoting on a SSRS Report
Now we have the model populated from the SSRS report and have added a calculated column. Now it is time to visualize. We can use a Pivot Table, Pivot Chart or PowerView to work with the Amity table in the model we just created. Let’s use a simple PivotTable. Simply click on the PivotTable button in the toolbar and you will be prompted to create a new worksheet or use an existing one to place the PivotTable. I will choose Sheet1. As shown in Figure 8.
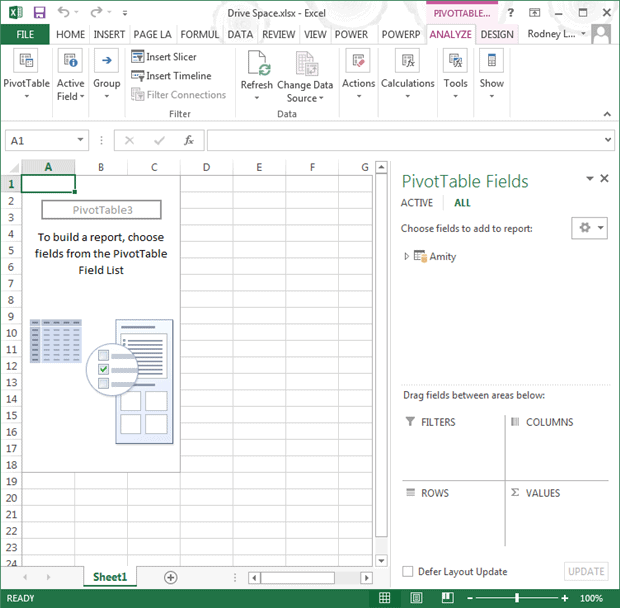
Figure 8 – PivotTable for Amity Table
I could spend the next 10 pages demonstrating PivotTables, PivotCharts and PowerView in more detail, but our focus is the utility of the SSRS Data Feed more rather than the finer points of Excel maneuverability, and I am going to make an assumption that you may already be familiar with building PivotTables.
PowerPivot reports in Excel 2013
If you need a primer or refresher, I recommend the tutorial at http://technet.microsoft.com/en-us/library/gg413497.aspx. If you prefer videos, try https://support.office.com/en-ie/article/power-view-and-power-pivot-videos-4386de23-041a-4792-b6ec-c40f72ecf693.
Figure 9 shows the end result of my power pivoting.
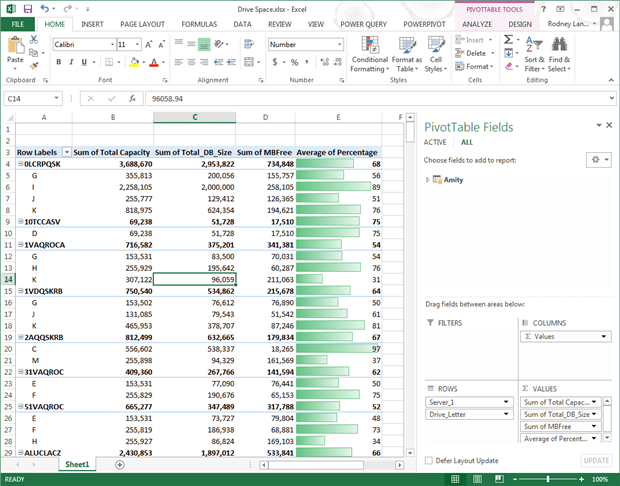
Figure 9 – A PivotTable from the SSRS Data Source Using Conditional Formatting.
So there it is, the data model generated from an existing SSRS report. All of the logic, parameters, connections and calculations from the original report can be reused here inside of Excel. As data changes in the underlying data source, we can refresh the Excel report with a simple click of a button. It is now possible for me to distribute this report to the Spreadmart universe and if the user has access to the report then they will be able to refresh, manipulate and analyze the same data.
The next steps for this test would be to deploy this worksheet to SharePoint where users can then take advantage of PowerPivot’s Analysis Services component as well as PowerView in SharePoint. What’s more, the data model itself can now be a data source for other applications. I have certainly just touched upon the possibilities.
Summary
As DBAs we are expected to know how to administer the technologies that are available with and peripheral to SQL Server. And to properly administer them, it certainly helps to understand the technology from the point of view of the user. By using an existing SSSRS report as a data feed for Excel, these users can now take advantage of development efforts in new ways, rather than shouldering the entire burden of writing their own reporting queries, or conversely relying solely on IT to develop new models and universes from ODS and EDW systems, which take long months to complete.
By following an interest to make use of existing development efforts via an SSRS report as a data feed to Excel, I touched upon several technologies in the BI stack, but have only really just started to understand what can be achieved. I will continue exploring interesting new features like the Windows Azure Marketplace and Data Alerts for SSRS reports as to examples. I hope this article gave you at least a good starting reference for an otherwise hidden gem of a data source.

Load comments