SQL Server auditing has never been my favorite aspect of a DBA’s work. In order to get a complete picture of your server at a transactional level, you need either full time Profiler tracing, or to enable C2 level auditing; both of which come at a cost that my clients and I are not willing to pay. These auditing tools will not only slow down your servers considerably, but the drive space required in order to keep a record of each transaction on your server is daunting at best.
The solution presented here is rooted in the idea that issues in a system will inevitably show up more than once. If you are having consistent issues with data loss, or unwanted record modification, then this collection of stored procedures may help you out. With this set of scripts, you can:
- Capture trace information about a server, on a set schedule
- Filter the captured data to suit your needs
- Archive the data for future auditing.
This solution also allows the trace data to be stored in a centralized location so you don’t have scattered auditing information cluttering up your SQL servers.
The Auditing Problem
Most DBAs will have experienced the scenario whereby a red-faced program/development manager storms up to them and demands to know why his ultra-critical tables keep getting truncated, and who is doing it.
I always had a canned response ready for such situations, which starts off something like this:
“Sorry < Insert Manager Name>, I can tell you when it happened, but we have no way of knowing who keeps truncating your tables.”
This usually incites much hand waving and unintelligible groaning on the part of the manager, followed by an adamant demand to know why we can’t point a finger at the idiot responsible for the data deletion faux pas. My standard response continues something like this.
“Well <Insert Manager Name>, we aren’t running C2-level auditing on that instance of SQL Server. We asked you about the possible need for this level of auditing in <Insert Month >, and you told us that we had better not “bog down” your SQL server and that disk space doesn’t <grow on trees/just fall from the sky/magically make itself available>. Without that level of auditing turned on, we can’t tell who or what is deleting your information.”
This confrontation ends, inevitably, with the manager storming off, ranting about proper auditing trails and accountability. Although, I grew almost fond of this little pantomime, I decided after the third or fourth enactment that I’d better develop a solution that I could present the next time a gremlin like this cropped up in one of our systems.
The Tracing Solution
The two stored procedures I present here offer a quick way to automatically enable customizable profiler traces on your SQL servers, as well as to centrally store trace information from any number of machines.
The code for handling the trace data is slightly different between SQL 2000 and SQL 2005, but the overall functional logic is essentially the same in each case. We provide the SQL 2005 versions of the scripts here, and the 2000 versions as a code download to this article (see the box to the right of the article title).
The first script, usp_startTrace, is used to initiate our customizable trace. This stored procedure handles all the tasks of setting up the tracing events, creating the trace file, setting up filters and starting the actual trace. The script is set up to look at five different trace events, and these happen to be the same default events that Profiler monitors, which are:
- Login Event
- Logout Events
- RPC Completion Events
- SQL Batch Completion Events
- SQL Batch Start Events
The script first looks to see if a trace with the name defined is already running. This is done by querying the central data storage server. This central storage is a linked server that has a database with the tables required to store and query this information. Script files to create this database on your linked server are included in the code download to this article.
Once the trace name has been checked, the script sets up a trace that matches the parameters you have supplied. This includes the ability to filter any of the trace event data columns with a keyword. The most common filter use will be on column 1, or text data, which holds the T-SQL code run by a user.
Finally, the script will store the trace information in the central auditing database for future use.
|
USE [msdb] GO SET ANSI_NULLS ON GO SET QUOTED_IDENTIFIER ON GO /* Procedure Name : usp_startTrace ——————————- Parameter 1 : traceName – Unique identifier of trace [Req] Parameter 2 : traceFile – Physical file to hold trace data while running [Req] Parameter 3 : maxFileSize – Maximum size that traceFile can grow to [Default: 5MB]5MB] Parameter 4 : filterColumn – Trace event data column to filter results on [Default: 0] Parameter 5 : filterKeyword – Keyword used when filterColumn is defined [Default: NULL] */ CREATE PROCEDURE [dbo].[usp_startTrace] @traceName NVARCHAR(50), @traceFile NVARCHAR(50), @maxFileSize BIGINT = 5, @filterColumn INT = 0, @filterKeyword NVARCHAR(50) = NULL AS SET NOCOUNT ON — Test for trace existence in the Trace_IDs table, alert user if trace is invalid — Change linked server name here IF EXISTS ( SELECT * FROM MYSERVER123.DBA_Info.dbo.Trace_IDs WHERE (TraceName = @traceName OR TraceFile = @traceFile) AND TraceServer = SERVERPROPERTY(‘ServerName’) ) BEGIN PRINT(‘Trace ‘ + @traceName + ‘ already exsists or the file is in use, please choose another name/file’) RETURN END /* Variable Declaration ——————– traceError – Will hold return code from sp_trace_create to validate trace creation TraceID – Will hold the system ID of the newly created trace on – Used byb sp_trace_setevent to turn on data columns for particular events */ DECLARE @traceError INT, @TraceID INT, @on BIT SET @on = 1 — Create the trace and store the output in traceError, then test traceError for failure — and alert the user if the trace cannot be started EXEC @traceError = sp_trace_create @TraceID output, 0, @traceFile, @maxFileSize, NULL
IF @traceError <> 0 BEGIN PRINT(‘Trace could not be started: ‘ + @traceError) RETURN END — Add events that we want to collect data on for the trace — Audit Login events (14) exec sp_trace_setevent @TraceID, 14, 1, @on exec sp_trace_setevent @TraceID, 14, 9, @on exec sp_trace_setevent @TraceID, 14, 6, @on exec sp_trace_setevent @TraceID, 14, 10, @on exec sp_trace_setevent @TraceID, 14, 14, @on exec sp_trace_setevent @TraceID, 14, 11, @on exec sp_trace_setevent @TraceID, 14, 12, @on — Audit Logout events (15) exec sp_trace_setevent @TraceID, 15, 15, @on exec sp_trace_setevent @TraceID, 15, 16, @on exec sp_trace_setevent @TraceID, 15, 9, @on exec sp_trace_setevent @TraceID, 15, 13, @on exec sp_trace_setevent @TraceID, 15, 17, @on exec sp_trace_setevent @TraceID, 15, 6, @on exec sp_trace_setevent @TraceID, 15, 10, @on exec sp_trace_setevent @TraceID, 15, 14, @on exec sp_trace_setevent @TraceID, 15, 18, @on exec sp_trace_setevent @TraceID, 15, 11, @on exec sp_trace_setevent @TraceID, 15, 12, @on — ExistingConnection events (17) exec sp_trace_setevent @TraceID, 17, 12, @on exec sp_trace_setevent @TraceID, 17, 1, @on exec sp_trace_setevent @TraceID, 17, 9, @on exec sp_trace_setevent @TraceID, 17, 6, @on exec sp_trace_setevent @TraceID, 17, 10, @on exec sp_trace_setevent @TraceID, 17, 14, @on exec sp_trace_setevent @TraceID, 17, 11, @on — RPC:Completed events (10) exec sp_trace_setevent @TraceID, 10, 15, @on exec sp_trace_setevent @TraceID, 10, 16, @on exec sp_trace_setevent @TraceID, 10, 1, @on exec sp_trace_setevent @TraceID, 10, 9, @on exec sp_trace_setevent @TraceID, 10, 17, @on exec sp_trace_setevent @TraceID, 10, 10, @on exec sp_trace_setevent @TraceID, 10, 18, @on exec sp_trace_setevent @TraceID, 10, 11, @on exec sp_trace_setevent @TraceID, 10, 12, @on exec sp_trace_setevent @TraceID, 10, 13, @on exec sp_trace_setevent @TraceID, 10, 6, @on exec sp_trace_setevent @TraceID, 10, 14, @on — SQL:BatchCompleted events (12) exec sp_trace_setevent @TraceID, 12, 15, @on exec sp_trace_setevent @TraceID, 12, 16, @on exec sp_trace_setevent @TraceID, 12, 1, @on exec sp_trace_setevent @TraceID, 12, 9, @on exec sp_trace_setevent @TraceID, 12, 17, @on exec sp_trace_setevent @TraceID, 12, 6, @on exec sp_trace_setevent @TraceID, 12, 10, @on exec sp_trace_setevent @TraceID, 12, 14, @on exec sp_trace_setevent @TraceID, 12, 18, @on exec sp_trace_setevent @TraceID, 12, 11, @on exec sp_trace_setevent @TraceID, 12, 12, @on exec sp_trace_setevent @TraceID, 12, 13, @on — SQL:BatchStarting events (13) exec sp_trace_setevent @TraceID, 13, 12, @on exec sp_trace_setevent @TraceID, 13, 1, @on exec sp_trace_setevent @TraceID, 13, 9, @on exec sp_trace_setevent @TraceID, 13, 6, @on exec sp_trace_setevent @TraceID, 13, 10, @on exec sp_trace_setevent @TraceID, 13, 14, @on — If a filter has been used, setup the filter column — and the keyword using sp_trace_setfilter IF @filterColumn > 0 BEGIN EXEC sp_trace_setfilter @traceID, @filterColumn, 0, 6, @filterKeyword END — Set the trace to status 1, running EXEC sp_trace_setstatus @TraceID, 1 — Log all needed trace information in the Trace_IDs table using the linked repository server — Change linked server name here INSERT INTO MYSERVER123.DBA_Info.dbo.Trace_IDs ( TraceName, TraceID, TraceFile, TraceServer ) VALUES ( @traceName, @TraceID, @traceFile, CONVERT(nvarchar(128), SERVERPROPERTY(‘ServerName’)) ) — Notify user of trace creation PRINT(‘Trace Started’) SET NOCOUNT OFF
GO |
One thing to remember is that the trace_data table in this script is specific to SQL Server 2005. There are scripts included in the article download that are version dependant. The central storage database can house both 2000 and 2005 data, but will use different tables depending on the version. The stored procedures are also version dependant and are respectively named. The reason for the slight difference is that the two versions handle trace data differently and have slightly differing schema.
The next script, usp_stopTrace, uses the data stored about the trace to archive the data and to close the trace after completion.
The procedure takes only one parameter, traceName, which it uses to query the central server to retrieve all of the data that was stored by the usp_startTrace script. This information includes the name, trace id and trace file. Once the data has been received, the trace is stopped and the records from the trace_data table are archived into the trace_archive table. The new trace file is then pushed into the trace_data table. So, you can always find the newest trace data in the trace_data table and any older trace information in the trace_archive table.
The trace file is then deleted from the server, via xp_cmdshell, and the trace identity is removed from the central repository to free up the trace name and id for future use.
| USE [msdb]
GO SET ANSI_NULLS ON GO SET QUOTED_IDENTIFIER ON GO /* Procedure Name : usp_stopTrace ——————————- Parameter 1 : traceName – Unique identifier of trace to be stopped [Req] */ CREATE PROCEDURE [dbo].[usp_stopTrace] @traceName NVARCHAR(50) AS SET NOCOUNT ON
/* Variable Declaration ——————– traceID – Will hold the ID of the trace that will be stopped and archived traceFile – The physical file to export data from command – Variable to hold the command to clean the traceFile from the server */ DECLARE @traceID INT, @traceFile NVARCHAR(100), @command NVARCHAR(150)
— Test for the trace via name in the repository, if it exsists proccess it, if not alert the user — Change linked server name here IF EXISTS ( SELECT * FROM MYSERVER123.DBA_Info.dbo.Trace_IDs WHERE TraceName = @traceName AND TraceServer = SERVERPROPERTY(‘ServerName’) ) BEGIN — Gather the traceID and traceFile from the respository – Change linked server name here SET @traceID = (SELECT TraceID FROM MYSERVER123.DBA_Info.dbo.Trace_IDs WHERE TraceName = @traceName AND TraceServer = SERVERPROPERTY(‘ServerName’)) — Change linked server name here SET @traceFile = (SELECT TraceFile FROM MYSERVER123.DBA_Info.dbo.Trace_IDs WHERE TraceName = @traceName AND TraceServer = SERVERPROPERTY(‘ServerName’)) — Set the status of the trace to inactive, then remove the trace from the server EXEC sp_trace_setstatus @traceID, 0 EXEC sp_trace_setstatus @traceID, 2 — Archive the older trace data and remove all records to make room for the new trace data — Change linked server name here INSERT INTO MYSERVER123.DBA_Info.dbo.trace_archive SELECT * FROM MYSERVER123.DBA_Info.dbo.trace_table
— Change linked server name here DELETE FROM MYSERVER123.DBA_Info.dbo.trace_table
— Change linked server name here INSERT INTO MYSERVER123.DBA_Info.dbo.trace_table SELECT * FROM ::fn_trace_gettable(@traceFile + ‘.trc’, default) — Remove the existing trace file for future use SET @command = ‘DEL ‘ + @traceFile + ‘.trc’ EXEC xp_cmdshell @command
— Delete the trace information from the repository — Change linked server name here DELETE FROM MYSERVER123.DBA_Info.dbo.Trace_IDs WHERE TraceName = @traceName AND TraceServer = SERVERPROPERTY(‘ServerName’)
— Alert the user that the trace has been stopped and archived PRINT(‘Trace ‘ + @traceName + ‘ Stopped and Archived’) RETURN END
— Alert the user that the trace was not found in the repository PRINT(‘Trace ‘ + @traceName + ‘ Not Found’)
SET NOCOUNT OFF GO |
Implementing the Solution
There are just a few steps that you will need to take in order to get these trace procedures working correctly in your environment.
1. Choose a main repository for your trace data, and modify the procedures to point to the machine on which you want to store the trace data. For example, I have my database, [DBA_Info], residing on a test machine.
Any version of SQL Server will work for the storage of data; the differences in the scripts are only due to changes in definitions of data collected in the traces.
2. Create a new database for the trace data, using the create database/table scripts included in the source code zip file to hold all of this data. You only need to run the create scripts for the version of the script you will be using, or both if you will be using the procedures on multiple machines, utilizing both SQL 2000 and SQL 2005. The results from either version are stored in separate tables so your repository database can contain both 2000 and 2005 archive trace data.
3. Set up a user with read/write permissions on the central storage database, to be used for the linked server credentials.
4. Use the new user credentials you have just made to setup a linked server on the SQL Server that you want to run an automated trace on.
5. In the usp_startTrace and usp_stopTrace scripts, locate the calls (all noted in the comments) that point to a generic linked server (MYSERVER123) and modify them to reflect the name of your central trace data repository server.
6. Run the create scripts each of the servers that will be performing the traces.
Once these stored procedures are installed, you can begin starting and stopping traces via a query window/query analyzer or through SQL Agent jobs.
Testing the Solution
Here is a quick example that demonstrates how to find the cause of all this grief for our beloved program manager. We create a new SQL Agent job to kick off at 5:30 PM (after business hours) involving only one step. In this step, we execute our start trace procedure, with the parameters needed to gather only the data relevant to our issue.
This will produce a trace named TrucateTrace The trace file will be stored in the root of the C drive. The maximum space the trace file should take is 10 MB and we will place a filter on the first column (text data) looking for any instances of the word “truncate”.
The last three parameters are optional and will be defaulted to 5 (trace file size in MB), 0 (no trace column) and NULL (no filter keyword) respectively. If you do not specify these parameters then a bare bones trace will be created with a maximum file size of 5 MB, and it will perform no filtering, so you will get all available data from the trace events.
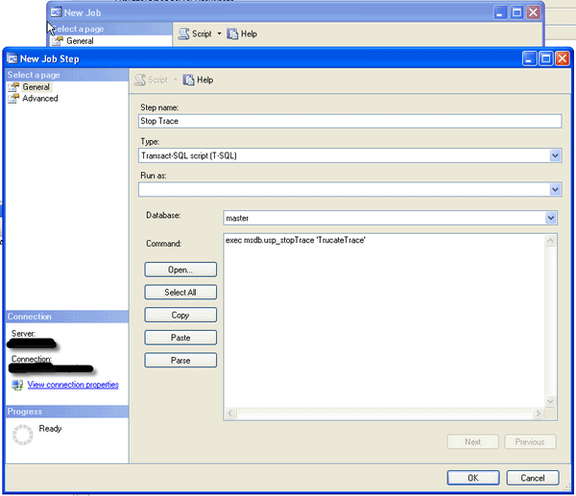
Alternately, we will create another job to run at 6:00 AM, calling the usp_stopTrace giving the same trace name.

This will stop any trace named TruncateTrace on this particular server and export all of the collected data into the repository table [trace_table]/[trace2k_table] on the linked data collection server.
Any older information will have been archived to the [trace_archive]/[trace2k_archive] table, depending on which version of SQL the trace was run on. All data is marked with the server name so we can still filter the archive table to look at older data from any server. The trace file is also cleaned up from the traced server so the filename will be available for future use. This will require that xp_cmdshell is available for use by the SQL Agent service account. From this point, all we have to do is look through our newly acquired trace_table data for the suspect.
Summary
I hope that these scripts can make life a little easier for those of use out there that do not run full auditing on all of your SQL servers. The trace scripts can easily be modified to include other columns and other trace events. I am presenting this as a spring board for any DBA out there that needs an automated solution for profiler tracing. If you do want to add any event or trace columns, I would look to http://msdn2.microsoft.com/en-us/library/ms186265.aspx for a complete list of all trace events and available data columns.
In any event, the next time you encounter the scenario detailed in the introduction, much job satisfaction can be gained from being able to respond something along the lines of:
“So <Manager Name>, we have been tracing that server all week and it seems that one of the DTS packages you wrote, and have running each night, is the problem. It is truncating the table in question each morning at 4:00 AM. Don’t be too hard on yourself though. We all make mistakes.”