
The execution plan cache in SQL Server is a treasure trove of information about queries that have recently executed. In addition to query text and execution plan details, a wide variety of statistics, options, and parameters are available to research, if needed. This information may not always be needed for troubleshooting a performance challenge, but when it is, knowing where to go and how to use it can be a massive time saver.
In this article, the attributes stored in the plan cache will be explored and structured into an easily consumable format. This can assist in researching unusual query behavior, such as poor performance, frequent recompiles, or anomalous results.
What is in the execution plan cache?
To understand and use information from the execution plan cache, a (very) brief review of the plan cache, its purpose, and usage is helpful.
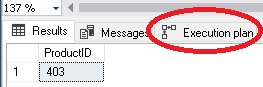
Processing a query in SQL Server requires that an execution plan be created and used. The plan provides instructions that detail how to retrieve, join, sort, and read/write data so that the results are what was requested by the query. When a query performs poorly, the execution plan can provide detail as to how it executed and why the query optimizer chose the plan that it did. A plan can be viewed directly in SQL Server Management Studio by turning it on in the GUI, like this:

Once enabled, an example query can be executed:
|
1 2 3 4 |
SELECT Product.ProductID FROM Production.Product WHERE Product.Name = 'External Lock Washer 3'; |
From here, a new tab appears, containing the execution plan:
Clicking on the tab reveals the execution plan details:
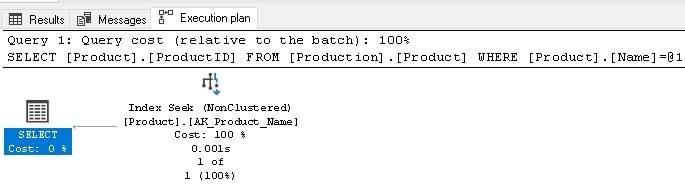
From here, further details such as row counts, IO, and CPU, can be found. Every shred of data that can be viewed here (and much more) is also available in system views that can be analyzed using T-SQL.
While a graphical plan is useful for manual troubleshooting of problems, using views allows for bulk analysis and the ability to automate some aspects of performance monitoring and performance tuning.
Microsoft provides extensive documentation on execution plans. If needed, this is a good place to start. Many useful articles have also been written on the topic, such as this excellent introduction by Grant Fritchey.
Using Dynamic Management Views to Analyze Execution Plans
There are a handful of system views and functions that provide valuable data about execution plans and related metrics. They are:
Sys.dm_exec_query_plan: This function provides the execution plan XML for a given plan_handle.
Sys.dm_exec_sql_text: A function that returns the text of a SQL statement for a given sql_handle.
Sys.dm_exec_query_stats: Contains a wealth of statistics for cached execution plans, such as timing, CPU, IO, row counts, and more.
Sys.dm_exec_cached_plans: Contains basic usage information about currently cached execution plans, including object type, size, and a count of plan uses.
Sys.dm_exec_plan_attributes: Details about how a plan was generated, such as compatibility level and SET options.
These views each provide useful data about queries that have executed in SQL Server and some or all may be needed to answer specific questions about them.
Note that these views only provide information about execution plans that are currently in the cache. No history is provided. As soon as a plan is removed from the cache, these views will no longer return information about it.
Similarly, if the SQL Server service is restarted or the plan cache cleared, then these views would also become empty (until queries were executed and they began to fill again). As such, treat these views as a transient window into SQL Server’s operation, and polling them repeatedly may be needed to fully understand an ongoing optimization challenge.
Example Execution Plan Details
To illustrate how to view this data, a simple example will be provided:
|
1 2 3 4 5 6 7 8 9 10 11 |
SELECT Product.ProductID, Product.Name, Product.Color, SalesOrderDetail.SalesOrderID, SalesOrderDetail.OrderQty, SalesOrderDetail.UnitPrice FROM Production.Product INNER JOIN Sales.SalesOrderDetail ON SalesOrderDetail.ProductID = Product.ProductID WHERE Product.Name = 'External Lock Washer 3'; |
This query returns an ID for a single product in this table:
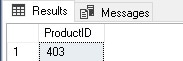
Now that this query has been executed, some of the views above can be queried to illustrate that the plan for this query is indeed in the plan cache and can be viewed accordingly:
|
1 2 3 4 5 6 7 8 9 10 11 12 13 14 15 |
SELECT dm_exec_cached_plans.plan_handle, dm_exec_sql_text.text, dm_exec_query_plan.query_plan, database_name = databases.name, dm_exec_query_stats.creation_time, dm_exec_query_stats.last_execution_time FROM sys.dm_exec_cached_plans CROSS APPLY sys.dm_exec_sql_text(plan_handle) CROSS APPLY sys.dm_exec_query_plan(plan_handle) INNER JOIN sys.dm_exec_query_stats ON dm_exec_query_stats.plan_handle = dm_exec_cached_plans.plan_handle LEFT JOIN sys.databases ON databases.database_id = dm_exec_query_plan.dbid WHERE dm_exec_sql_text.text LIKE '%External Lock Washer 3%' |
The filter ensures that only the most recent query that is being tested is included in the results. This query begins in dm_exec_cached_plans and joins in to other views to retrieve the query text, execution plan and the creation/last execution times, and the database name:
![]()
Plan_handle provides a unique identifier that can be using in other system views/functions to expand on the data returned. The query plan is XML and can be clicked on in SQL Server Management Studio to view its graphical representation.
From this starting point, many different metrics, properties, and details can be gathered by using these views to group, filter, and return additional columns describing a query’s execution.
NOTE: If a server has Optimize for ad-hoc workloads enabled, then queries in this article may need to be run multiple times to create a full plan (not a stub) in the cache. Additionally, if the test server is experiencing plan cache pressure, plans may not reside in cache for long before being evicted. For these reasons, if results are not displaying as expected while working through this article, rerun this (or any) test query to generate more data in the cache to work with.
Digging into Plan Attributes
Of the various system views and functions that have been discussed so far, sys.dm_exec_plan_attributes is by far the most poorly documented and least used. Therefore, this is an excellent opportunity to learn about its contents and how to better view the data exposed in the view!
To ensure that expectations are set, feel free to view the Microsoft documentation on this view. Makes perfect sense, right? To begin, all columns returned by the function can be viewed like this:
|
1 2 3 4 5 6 7 8 9 10 11 12 13 14 |
DECLARE @plan_handle UNIQUEIDENTIFIER; SELECT @plan_handle = dm_exec_cached_plans.plan_handle FROM sys.dm_exec_cached_plans CROSS APPLY sys.dm_exec_sql_text(plan_handle) WHERE dm_exec_sql_text.text LIKE '%External Lock Washer 3%' SELECT dm_exec_cached_plans.plan_handle, dm_exec_plan_attributes.* FROM sys.dm_exec_cached_plans OUTER APPLY sys.dm_exec_plan_attributes(plan_handle) WHERE cacheobjtype = 'Compiled Plan' AND dm_exec_cached_plans.plan_handle = @plan_handle ORDER BY dm_exec_plan_attributes.attribute; |
This query pulls the plan handle for a single query of interest and returns all attributes for that plan:
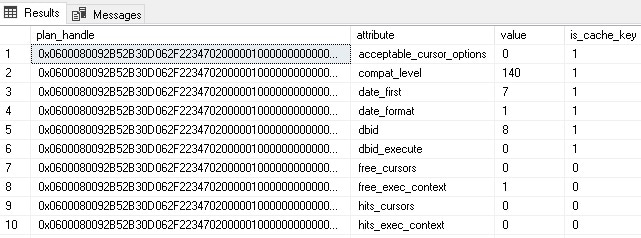
To make use of any of these attributes requires decoding and understanding its contents. The remainder of this article will be dedicated to a handful of attributes within sys.dm_exec_plan_attributes and how to make the most of them.
NOTE: Throughout this article, a filter is added to dm_exec_cached_plans to filter for “Compiled Plan” only. Attributes are also available for plan stubs, parse trees, and other objects that are stored in the cache. Therefore, for data collection purposes, there may be value in changing or removing this filter to expand the scope of these scripts.
Compatibility Level
A simple attribute to view is compatibility level:
|
1 2 3 4 5 6 7 8 9 10 11 12 |
SELECT dm_exec_plan_attributes.attribute, dm_exec_plan_attributes.value, COUNT(*) AS execution_plan_count FROM sys.dm_exec_cached_plans OUTER APPLY sys.dm_exec_plan_attributes(plan_handle) WHERE cacheobjtype = 'Compiled Plan' AND dm_exec_plan_attributes.attribute = 'compat_level' GROUP BY dm_exec_plan_attributes.attribute, dm_exec_plan_attributes.value ORDER BY dm_exec_plan_attributes.attribute, dm_exec_plan_attributes.value; |
This returns a row per compatibility level for all plans currently in the cache:
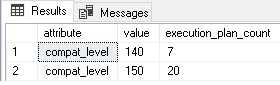
This is an excellent example of how attributes can be checked at a high level, and then if anything unexpected is found, further research could be conducted to determine the sources of unexpected compatibility levels. For example, some details for a specific compatibility level can be returned like this:
|
1 2 3 4 5 6 7 8 9 10 11 12 13 14 15 16 |
SELECT dm_exec_cached_plans.plan_handle, dm_exec_cached_plans.usecounts, dm_exec_plan_attributes.attribute, dm_exec_plan_attributes.value, dm_exec_sql_text.text AS query_text, databases.name AS database_name FROM sys.dm_exec_cached_plans CROSS APPLY sys.dm_exec_query_plan(plan_handle) LEFT JOIN sys.databases ON databases.database_id = dm_exec_query_plan.dbid OUTER APPLY sys.dm_exec_plan_attributes(plan_handle) CROSS APPLY sys.dm_exec_sql_text(plan_handle) WHERE cacheobjtype = 'Compiled Plan' AND dm_exec_plan_attributes.attribute = 'compat_level' AND dm_exec_plan_attributes.value = 150; |
The results provide some additional information about any execution plan that was generated using compatibility level 150 (SQL Server 2019):

Additional columns can be added from their respective views/functions to learn more about the query and its origin if more details are needed.
Research like this could be especially useful during or after a SQL Server upgrade project to ensure that queries are executing using the expected compatibility level. Note that the compatibility mode shown here is that of the database where the T-SQL (and therefore the execution plan) originated. If the plan source is a stored proc or function, the compatibility level returned will be that of the database containing the proc/function.
For a full list of compatibility modes, Microsoft provides extensive detailed documentation.
Set Options
The SET options used when an execution plan is generated can have a wide array of implications on how the query executes. Settings such as ANSI_NULLS, QUOTED_IDENTIFIER, ARITH_ABORT, and others fundamentally alter the rules followed by the optimizer and how data is processed by SQL Server. This ultimately means that the results of a query can vary based on these settings and unexpected settings can even lead to errors.
Query settings are established when a connection is made to SQL Server, and defaults are defined at both the server and database level to manage them. An application running a query can specify a setting at the time of the connection, which will force that setting instead of the defaults. Because of this complexity, it is not hard for queries to be executed with unexpected settings. It can also be challenging to track down the culprit, when needed.
The same query with different SET options will generate different execution plans, therefore bloating the cache with repeated copies of the same query. Some SET options can trigger recompilations if changed during the middle of a batch, thus wasting resources recompiling what should have been a perfectly valid execution plan. This is because execution plans are generated using the settings provided by the connection string when a session was first created. If those connection settings change at a later time, then any execution plans using the old settings would no longer be valid for subsequent queries in that batch.
To further complicate the matter, this data is stored in a single row per execution plan within dm_exec_plan_attributes and is encoded in a numeric bitmap. The set options can be viewed for our previous test query using the following query:
|
1 2 3 4 5 6 7 8 9 10 11 12 13 14 |
SELECT dm_exec_plan_attributes.attribute, dm_exec_plan_attributes.value, dm_exec_sql_text.text AS query_text, databases.name AS database_name FROM sys.dm_exec_cached_plans CROSS APPLY sys.dm_exec_query_plan(plan_handle) LEFT JOIN sys.databases ON databases.database_id = dm_exec_query_plan.dbid OUTER APPLY sys.dm_exec_plan_attributes(plan_handle) CROSS APPLY sys.dm_exec_sql_text(plan_handle) WHERE cacheobjtype = 'Compiled Plan' AND dm_exec_plan_attributes.attribute = 'set_options' AND dm_exec_sql_text.text LIKE '%External Lock Washer 3%'; |
The results are as follows:
![]()
The SET options are indicated with a single number: 4347. This is a sum of predefined bits where each bit indicates a specific set option where 1 is ON and 0 is OFF. The Microsoft documentation link at the beginning of this section provides a complete list of SET options and the bits they map to. There are 19 SET options identified at the time of this article’s writing, therefore, they will not be copied here in detail. Some are version-specific, and therefore may not apply to older versions of SQL Server.
Using the list provided by Microsoft, it can be determined (slowly) that 4347 equates to the following SET options being turned ON:
ARITH_ABORT (4096)
ANSI_NULL_DFLT_ON (128)
QUOTED_IDENTIFIER (64)
ANSI_NULLS (32)
ANSI_WARNINGS (16)
CONCAT_NULL_YIELDS_NULL (8)
ParallelPlan (2)
ANSI_PADDING (1)
4096 + 128 + 64 + 32 + 16 + 8 + 2 + 1 = 4347
This is a mess! Without an automated process to provide easy-to-read results, we are destined to make mathematical or clerical errors and misread this data.
The following query takes all cached plans and converts their SET options into a list of columns, each with the name of the SET option and a 1 or 0 to indicate its status for its respective plan:
|
1 2 3 4 5 6 7 8 9 10 11 12 13 14 15 16 17 18 19 20 21 22 23 24 25 26 27 28 29 30 31 32 33 34 35 36 37 38 39 40 41 42 43 44 45 46 47 48 49 50 51 52 53 54 55 56 57 58 59 60 61 62 63 64 65 66 67 68 69 70 71 72 73 74 75 76 77 78 79 80 81 82 83 84 85 86 87 88 89 90 91 92 93 94 95 96 97 98 99 100 101 102 |
WITH CTE_SET_OPTIONS_PIVOT AS ( SELECT plan_handle, objtype, pvt.set_options AS set_options_sql_variant, CAST(pvt.set_options AS INT) AS set_options FROM (SELECT dm_exec_cached_plans.plan_handle, dm_exec_cached_plans.objtype, dm_exec_plan_attributes.attribute, dm_exec_plan_attributes.value FROM sys.dm_exec_cached_plans OUTER APPLY sys.dm_exec_plan_attributes(plan_handle) WHERE cacheobjtype = 'Compiled Plan') PLAN_ATTRIBUTES PIVOT (MAX(PLAN_ATTRIBUTES.value) FOR PLAN_ATTRIBUTES.attribute IN ([set_options])) AS pvt), CTE_SET_OPTIONS AS ( SELECT set_options, objtype, COUNT(*) AS plan_count FROM CTE_SET_OPTIONS_PIVOT GROUP BY set_options, objtype), CTE_RESULTS AS ( SELECT set_options, objtype, plan_count, 262144 AS divider, CAST('' AS VARCHAR(MAX)) AS bitwise_result, set_options AS set_options_intermediary FROM CTE_SET_OPTIONS UNION ALL SELECT set_options, objtype, plan_count, CAST(divider / 2 AS INT) AS divider, CASE WHEN set_options_intermediary >= divider THEN bitwise_result + '1' ELSE bitwise_result + '0' END AS bitwise_result, CASE WHEN set_options_intermediary >= divider THEN set_options_intermediary - divider ELSE set_options_intermediary END AS set_options_intermediary FROM CTE_RESULTS WHERE divider >= 1) SELECT set_options, objtype, plan_count, bitwise_result, CASE WHEN SUBSTRING(bitwise_result, 1, 1) = '1' -- Applies To: SQL Server 2012 (11.x) to SQL Server 2019 (15.x) THEN 1 ELSE 0 END AS ROWCOUNT_262144, CASE WHEN SUBSTRING(bitwise_result, 2, 1) = '1' -- Indicates that the database option PARAMETERIZATION --was set to FORCED when the plan was compiled. THEN 1 ELSE 0 END AS UPON_131072, CASE WHEN SUBSTRING(bitwise_result, 3, 1) = '1' THEN 1 ELSE 0 END AS LanguageID_65536, CASE WHEN SUBSTRING(bitwise_result, 4, 1) = '1' THEN 1 ELSE 0 END AS DATEFORMAT_32768, CASE WHEN SUBSTRING(bitwise_result, 5, 1) = '1' THEN 1 ELSE 0 END AS DATEFIRST_16384, CASE WHEN SUBSTRING(bitwise_result, 6, 1) = '1' THEN 1 ELSE 0 END AS NUMERIC_ROUNDABORT_8192, CASE WHEN SUBSTRING(bitwise_result, 7, 1) = '1' THEN 1 ELSE 0 END AS ARITH_ABORT_4096, -- Indicates that the query was submitted by internal --system stored procedures. CASE WHEN SUBSTRING(bitwise_result, 8, 1) = '1' THEN 1 ELSE 0 END AS ResyncQuery_2048, CASE WHEN SUBSTRING(bitwise_result, 9, 1) = '1' -- Indicates that the plan contains single row --optimization for AFTER trigger delta tables. THEN 1 ELSE 0 END AS TriggerOneRow_1024, -- Indicates that the plan does not use a work table to --implement a FOR BROWSE operation. CASE WHEN SUBSTRING(bitwise_result, 10, 1) = '1' THEN 1 ELSE 0 END AS NoBrowseTable_512, CASE WHEN SUBSTRING(bitwise_result, 11, 1) = '1' THEN 1 ELSE 0 END AS ANSI_NULL_DFLT_OFF_256, CASE WHEN SUBSTRING(bitwise_result, 12, 1) = '1' THEN 1 ELSE 0 END AS ANSI_NULL_DFLT_ON_128, CASE WHEN SUBSTRING(bitwise_result, 13, 1) = '1' THEN 1 ELSE 0 END AS QUOTED_IDENTIFIER_64, CASE WHEN SUBSTRING(bitwise_result, 14, 1) = '1' THEN 1 ELSE 0 END AS ANSI_NULLS_32, CASE WHEN SUBSTRING(bitwise_result, 15, 1) = '1' THEN 1 ELSE 0 END AS ANSI_WARNINGS_16, CASE WHEN SUBSTRING(bitwise_result, 16, 1) = '1' THEN 1 ELSE 0 END AS CONCAT_NULL_YIELDS_NULL_8, CASE WHEN SUBSTRING(bitwise_result, 17, 1) = '1' THEN 1 ELSE 0 END AS FORCEPLAN_4, CASE WHEN SUBSTRING(bitwise_result, 18, 1) = '1' -- Indicates that the plan paralleism options have changed. THEN 1 ELSE 0 END AS ParallelPlan_2, CASE WHEN SUBSTRING(bitwise_result, 19, 1) = '1' THEN 1 ELSE 0 END AS ANSI_PADDING_1 FROM CTE_RESULTS WHERE divider = 0 ORDER BY plan_count DESC |
This (big) query manages the following tasks:
- Convert the set_options label into a column header with its value as data beneath it.
- Aggregates by
SEToptions and object type. - Uses a recursive CTE to process each bit for the
SEToptions and convert the numeric representation into a binary bitmap (1s and 0s). - Uses a
CASEstatement to evaluate eachBITand return a column header for each with the values beneath it.
The results look like this:

This allows quick and easy review of the results. The column headers are written to match Microsoft’s documentation exactly.
A query like this performs a similar function to the compatibility level check above, allowing a high-level query to see all of the SET options combinations that are present on a server quickly. Using that data, it can be determined if a problem exists, and if so, query for more detailed data to determine the application that is generating the anomalous connection settings.
DATEFORMAT and DATEFIRST
These settings affect how dates are processed and will directly impact the results of any math involving them. Therefore, unexpected values will eventually result in bad data and/or errors when invalid dates are processed.
Viewing this data in sys.dm_exec_cached_plans is straightforward:
|
1 2 3 4 5 6 7 8 9 10 |
SELECT dm_exec_cached_plans.objtype, dm_exec_cached_plans.plan_handle, dm_exec_plan_attributes.attribute, dm_exec_plan_attributes.value FROM sys.dm_exec_cached_plans OUTER APPLY sys.dm_exec_plan_attributes(plan_handle) WHERE cacheobjtype = 'Compiled Plan' AND attribute = 'date_format' ORDER BY dm_exec_plan_attributes.attribute; |
Interpreting it requires a bit more work:
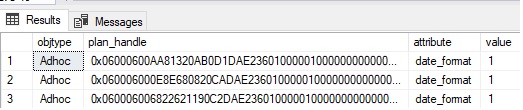
What does 1 mean? Presumably it means that dates are ordered Month/Day/Year, as is the default on my server. Other values can be tested via experimentation:
|
1 2 |
SET DATEFORMAT 'dmy'; SELECT TOP 1 * from Production.Product; |
This alters the date format to another common format – Day/Month/Year. The results in the DMV are as follows:
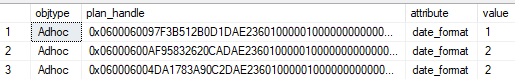
The new query (run a few times) correlates with a date format of 2. Further testing provides the following range of values:
|
Date Format |
DATEFORMAT Attribute Value |
|
MMDDYY |
1 |
|
DDMMYY |
2 |
|
YYMMDD |
3 |
|
YYDDMM |
4 |
|
MMYYDD |
5 |
|
DDYYMM |
6 |
While an application may provide localization options for its users, allowing them to enter dates using different formats, it is important that this data is entered into SQL Server using the correct date format. This is a task that is better handled by the application, rather than the database. This avoids the error-prone need to adjust date format settings on-the-fly when modifying dates within a database.
If an invalid date format is suspected, checking the execution plan cache to ensure that all values are consistent and match the expected format in the chart above can confirm if a problem exists and allow further data to be pulled from the cache to troubleshoot and resolve the discrepancy.
The date_first attribute returns the first day of the week, which is important when performing date calculations on weekdays, or when describing data between different localities that may have Sunday or Monday as the first day of the week.
Values for this attribute range from 1 (Monday) through 7 (Sunday). The SQL Server default is 7 (Sunday). The server-wide setting can be returned with this statement:
|
1 |
SELECT @@DATEFIRST; |
Similar to earlier, the following query returns this attribute for all cached queries:
|
1 2 3 4 5 6 7 8 9 10 |
SELECT dm_exec_cached_plans.objtype, dm_exec_cached_plans.plan_handle, dm_exec_plan_attributes.attribute, dm_exec_plan_attributes.value FROM sys.dm_exec_cached_plans OUTER APPLY sys.dm_exec_plan_attributes(plan_handle) WHERE cacheobjtype = 'Compiled Plan' AND attribute = 'date_first' ORDER BY dm_exec_plan_attributes.attribute; |
The results show that all plans in my local cache are set to the default of 7:
This setting can be adjusted on my local connection via this statement:
|
1 |
SET DATEFIRST 1; |
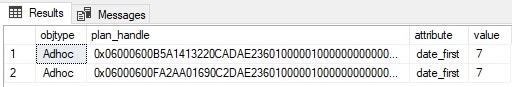
When a few dummy queries are run, followed by the query against the plan cache from above, the results show mixed values for the date_first attribute:
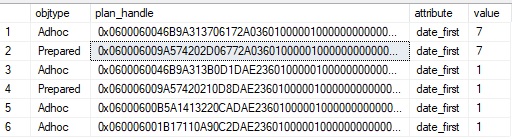
If an application is seeing anomalous values for calculations involving the day of the week (DW), then checking this attribute is a great test to ensure that there is not an unexpected setting of it being passed in via a connection string.
Other Attributes
At the time of this writing, there are 30 documented attributes stored in sys.dm_exec_plan_attributes. The list is likely to grow as new SQL Server features are released that impact plan generation and need to be documented.
While it is impractical to review all of these attributes as many are either mundane or infrequently used, there are a few others that are worth a brief mention:
dbid
This is the database that the plan references, which typically will be the database that the batch originated.
sql_handle
This GUID can be used to link execution plans to their underlying SQL text, which can be found in sys.dm_exec_sql_text. Since query text can get large, many developers and administrators will hash it to allow common queries to be grouped together, without the need to maintain potentially massive amounts of text.
inuse_exec_context
This one is interesting as it can provide the number of currently executing batches that are using this execution plan. It’s a good way to measure concurrency for a plan and how often it is reused at a finer granularity than via sys.dm_exec_query_stats.
SQL Server plan cache mining
SQL Server maintains an extensive treasure trove of detail regarding execution plans and the metadata relating to them. Using the dynamic management views referenced in this article, it is possible to understand how a query was executed and some details that can impact performance, results, and execution plan reuse.
While the function dm_exec_plan_attributes is not the easiest system object to consume, saving and using pre-written queries can save immense time, especially when a performance problem is identified that requires immediate attention.
Since runtime connection settings can differ from system or database defaults, being able to quickly identify those differences can assist in resolving application bugs or find rogue queries that are not behaving as expected.